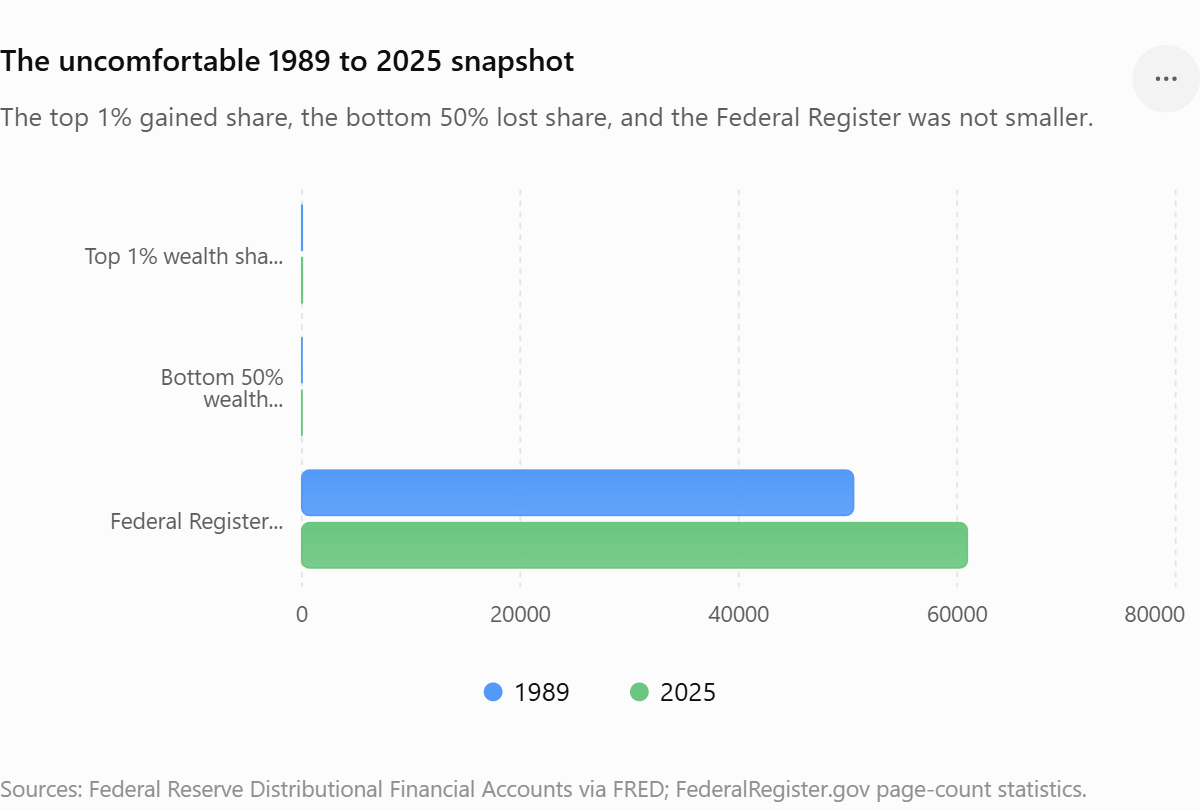
Visual Capitalist has a chart showing how America’s household wealth distribution changed from 1989 to 2025. The graphic is based on Federal Reserve Distributional Financial Accounts data, and the picture is ugly in the usual way: the top 1 percent held 23.0 percent of household net worth in Q4 1989 and 31.8 percent in Q4 2025, while the bottom 50 percent went from 3.4 percent to 2.5 percent over the same period. In dollar terms, the top 1 percent went from about $4.8 trillion in Q4 1989 to $55.4 trillion in Q4 2025, while the entire bottom half went from about $710 billion to $4.3 trillion.
The implied message most people will read into a chart like this is simple: wealth concentration is getting worse, therefore we need more government action to fix it. That’s the standard caption even when it’s not printed under the chart. It’s also where the analysis starts to go wobbly, because the period from 1989 to 2025 wasn’t some libertarian desert where the government wandered off and left the market unsupervised. It was a period of expanding federal law, expanding administrative complexity, expanding tax complexity, expanding public spending, expanding compliance departments, expanding financial regulation, expanding healthcare regulation, expanding education subsidies, expanding housing interventions, and expanding paperwork in nearly every corner of economic life.
The Federal Register’s own statistics show 50,501 actual pages in 1989 and 60,917 in 2025, with a much larger spike to 106,109 actual pages in 2024. Page counts aren’t a perfect measure of regulatory burden, but they’re a decent smoke alarm for administrative complexity. The Code of Federal Regulations has also ballooned over the modern era. One estimate puts the CFR at 138,049 pages in 2000 and 190,260 pages by the end of 2023.
The tax story is also not as clean as the “tax cuts caused everything” camp wants it to be. The top individual federal income tax rate was pushed down after the 1986 tax reform and sat around 28 percent to 33 percent in the late 1980s, depending on the phaseout effects. Today, the top statutory individual rate is 37 percent for 2025 taxable income above $626,350 for single filers. That doesn’t mean the wealthy are “overtaxed,” and it doesn’t mean effective tax rates are higher in every asset class. Capital gains, corporate taxation, estate taxation, carried interest, deductions, shelters, unrealized gains, and borrowing against appreciated assets all complicate the picture. But that’s exactly the point: the current system isn’t a clean low-tax free market. It’s a high-complexity tax maze where people with lawyers, lobbyists, accountants, captive insurance structures, deferred compensation tools, private equity vehicles, and foundation games can move like water while normal people get mugged by forms.
This is the part the usual inequality sermon skips. Regulation and taxation don’t just reduce power. Bad regulation and complex taxation can concentrate power. A giant company can hire a compliance department. A startup gets a bill it can’t read. A wealthy household can pay a tax attorney to restructure income. A middle-class household uses TurboTax and hopes the IRS dragon doesn’t wake up. A large incumbent can absorb licensing delays, reporting requirements, ESG disclosures, healthcare mandates, labor classification rules, environmental paperwork, and financial reporting rules as a cost of doing business. A small competitor eats the same rule as a percentage of its oxygen supply.
Research on regulatory compliance costs has repeatedly found that compliance burdens are not evenly distributed across firms. One study summarized by NBER notes that regulatory costs with scale effects can favor larger players over smaller competitors, reducing entry and favoring concentration. The OECD’s 2025 work also links rising regulatory compliance costs with lower productivity and weaker business dynamism, including a lower share of workers employed by young firms. Put in RackBrains terms, the bigger the rulebook gets, the more the rulebook becomes part of the moat.
That’s why the lazy answer of “just regulate wealth harder” deserves a skeptical eyebrow. We’ve been adding rules for decades, and the distribution got worse. We’ve been adding tax code complexity for decades, and the richest people got better at routing around it. We’ve been adding subsidies and interventions in housing, education, healthcare, finance, and retirement, and the sectors most soaked in policy are often the sectors where prices became most ridiculous. The government didn’t disappear from these markets. In many cases, it became the plumbing, the inspector, the subsidy pipe, the licensing office, the risk backstop, and the favored-client concierge.
That doesn’t mean every regulation is bad. Nobody sane wants poisoned food, fake drugs, collapsing bridges, financial fraud, or factories using workers as disposable machine parts. The choice isn’t between “no rules” and “infinite rules.” That’s the cartoon version. The real question is whether the rule set protects ordinary people and open competition, or whether it creates a bureaucratic castle where the already powerful can pull up the ladder, hand the paperwork to staff counsel, and call it public interest.
The wealth chart should be read alongside a second chart nobody likes to show: the growth of the administrative state did not prevent the top from pulling away. In some cases, it likely helped the top pull away by making capital, credentials, scale, legal navigation, and political access more valuable. If the cost of entering a market rises, ownership of existing market positions becomes more valuable. If asset prices inflate through monetary policy, subsidized credit, restricted supply, and policy-protected institutions, asset owners win first. If the tax code punishes wage income more predictably than unrealized capital gains, workers get the straightjacket while asset owners get the escape room.
The fix is not to stare at the Visual Capitalist chart and demand a bigger machine. The fix is to ask what kind of machine we’ve already built. Does it make it easier for a normal person to build wealth, start a business, buy a house, save capital, own productive assets, and compete with incumbents? Or does it make the economy safer for organizations large enough to hire navigators?
A serious anti-inequality agenda would not just raise rates and add another thousand pages of instructions. It would simplify the tax code, reduce carveouts, attack regulatory capture, make housing easier to build, make small business formation less punitive, stop subsidizing credential inflation, restore price discovery where government has blurred it, and focus antitrust on market power rather than using regulation as a side door for political theater. It would care less about symbolic punishment and more about whether people outside the top tier can actually accumulate durable assets.