That “Generous Pension” Ranking Doesn’t Actually Rank Retirement Living Standards
A recent Visual Capitalist graphic makes for an arresting comparison of retirement systems. Spain supposedly replaces 80.4% of a worker’s income in retirement, Greece 79.6%, Colombia 74.8%, and the Netherlands 74.7%. The United States sits far down the list at 39.7%. At first glance the conclusion seems obvious: Spain and Greece have extraordinarily generous pensions, Colombia has a much better retirement system than the United States, and Americans are getting a fairly miserable deal.
But, that’s not actually what the data measure. The numbers are real OECD numbers, and Visual Capitalist has represented them correctly. But the metric is narrow enough that interpreting the chart as a ranking of how well retirees live produces some very strange conclusions.
The VC chart measurement
The statistic is the OECD’s future gross pension replacement rate which models a hypothetical average-wage worker who starts a full career at age 22 under today’s pension rules and works until the applicable retirement age. It then asks what percentage of that worker’s earnings would be replaced by mandatory public and private pension programs.
The OECD average is 52%. Spain reaches 80.4%, Greece 79.6%, Luxembourg 75.6%, Colombia 74.8%, the Netherlands 74.7%, and the United States 39.7%. It’s useful information, but it’s a measure of income replacement, not a measure of retirement income. This is a bit of subterfuge analysis when seventy-five percent of a relatively low wage can buy less than 45% of a much larger wage. A retiree doesn’t pay the grocery bill with a replacement rate. The denominator changes everything, if you compare Colombia and Switzerland, the OECD model gives Colombia a 74.8% mandatory replacement rate, compared with only 42.4% for Switzerland. On the original ranking, Colombia therefore looks much more generous. But OECD average wages adjusted for purchasing power are dramatically different. The 2024 average wage is about $20,293 in purchasing-power-adjusted dollars in Colombia and $102,611 in Switzerland. Apply the OECD replacement rates to those wage bases and the picture flips. A simple model gives a Colombian average earner a future mandatory pension with purchasing power of roughly $15,200 a year, while the Swiss figure is roughly $43,500. Mexico provides an even sharper example. Its 69.6% replacement rate looks excellent in the original chart, but its OECD average wage is only about $19,311 in PPP terms. The modeled pension therefore comes to roughly $13,400 of annual purchasing power.
Actual pension payments tell another story
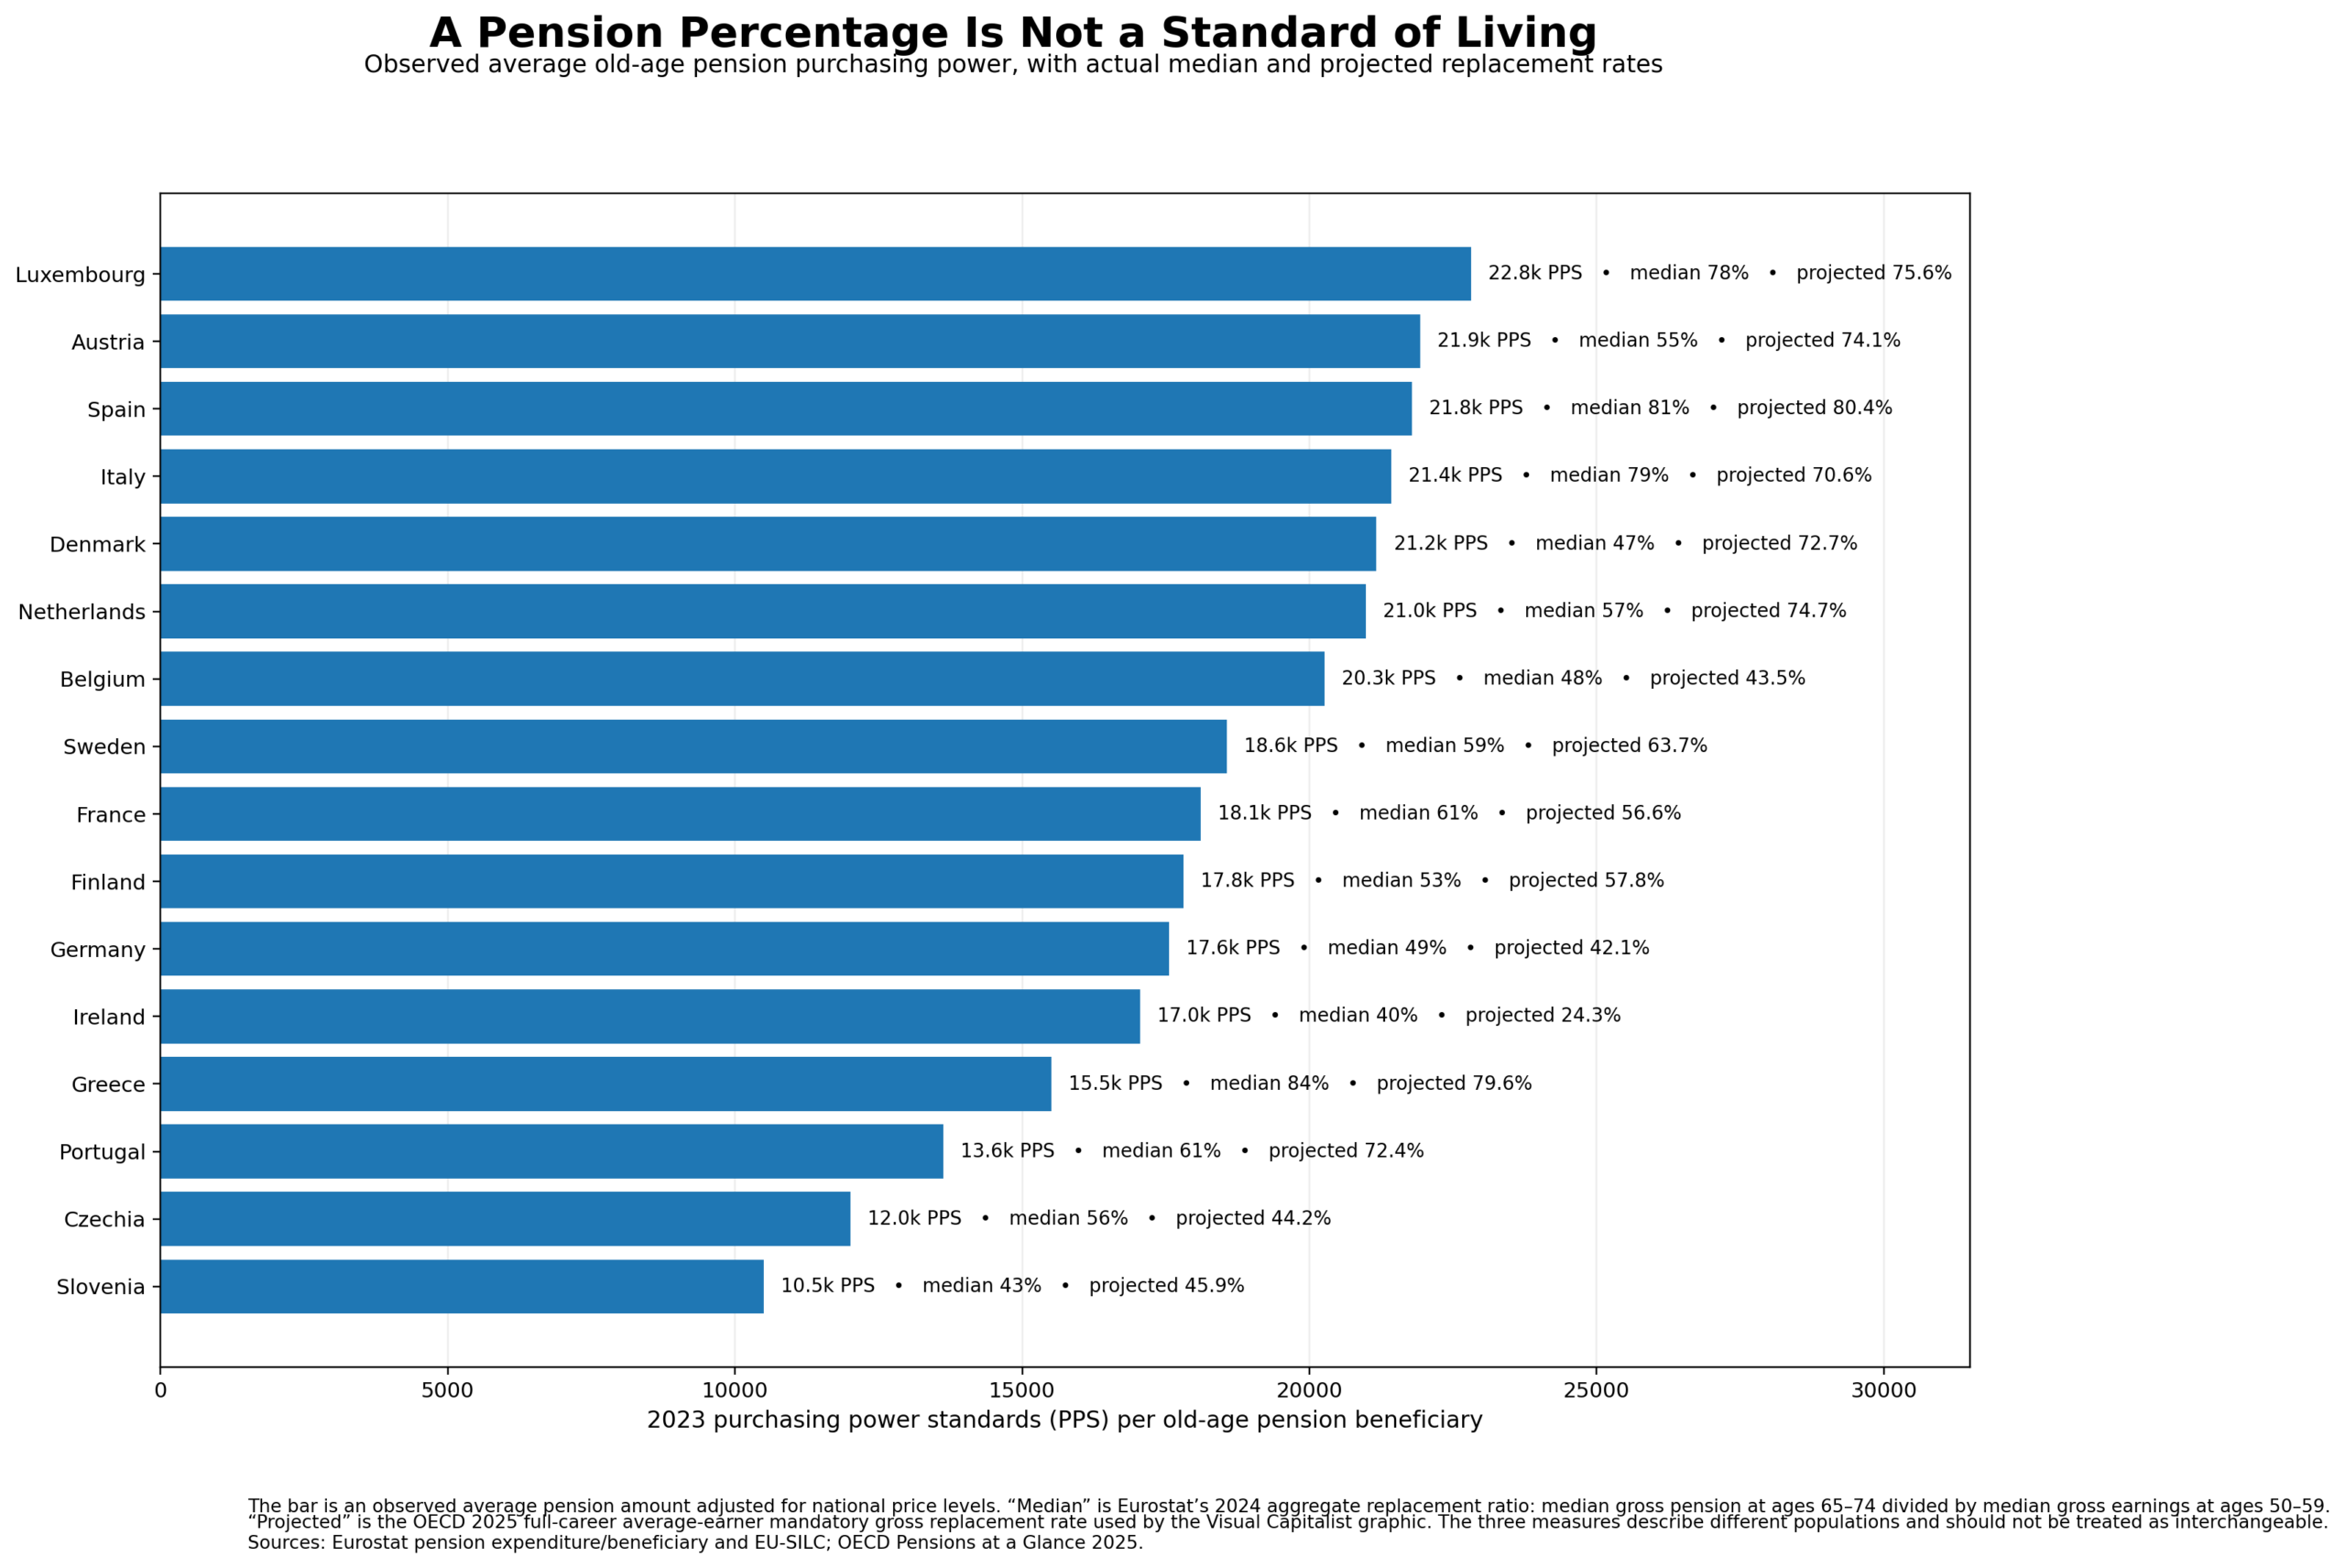
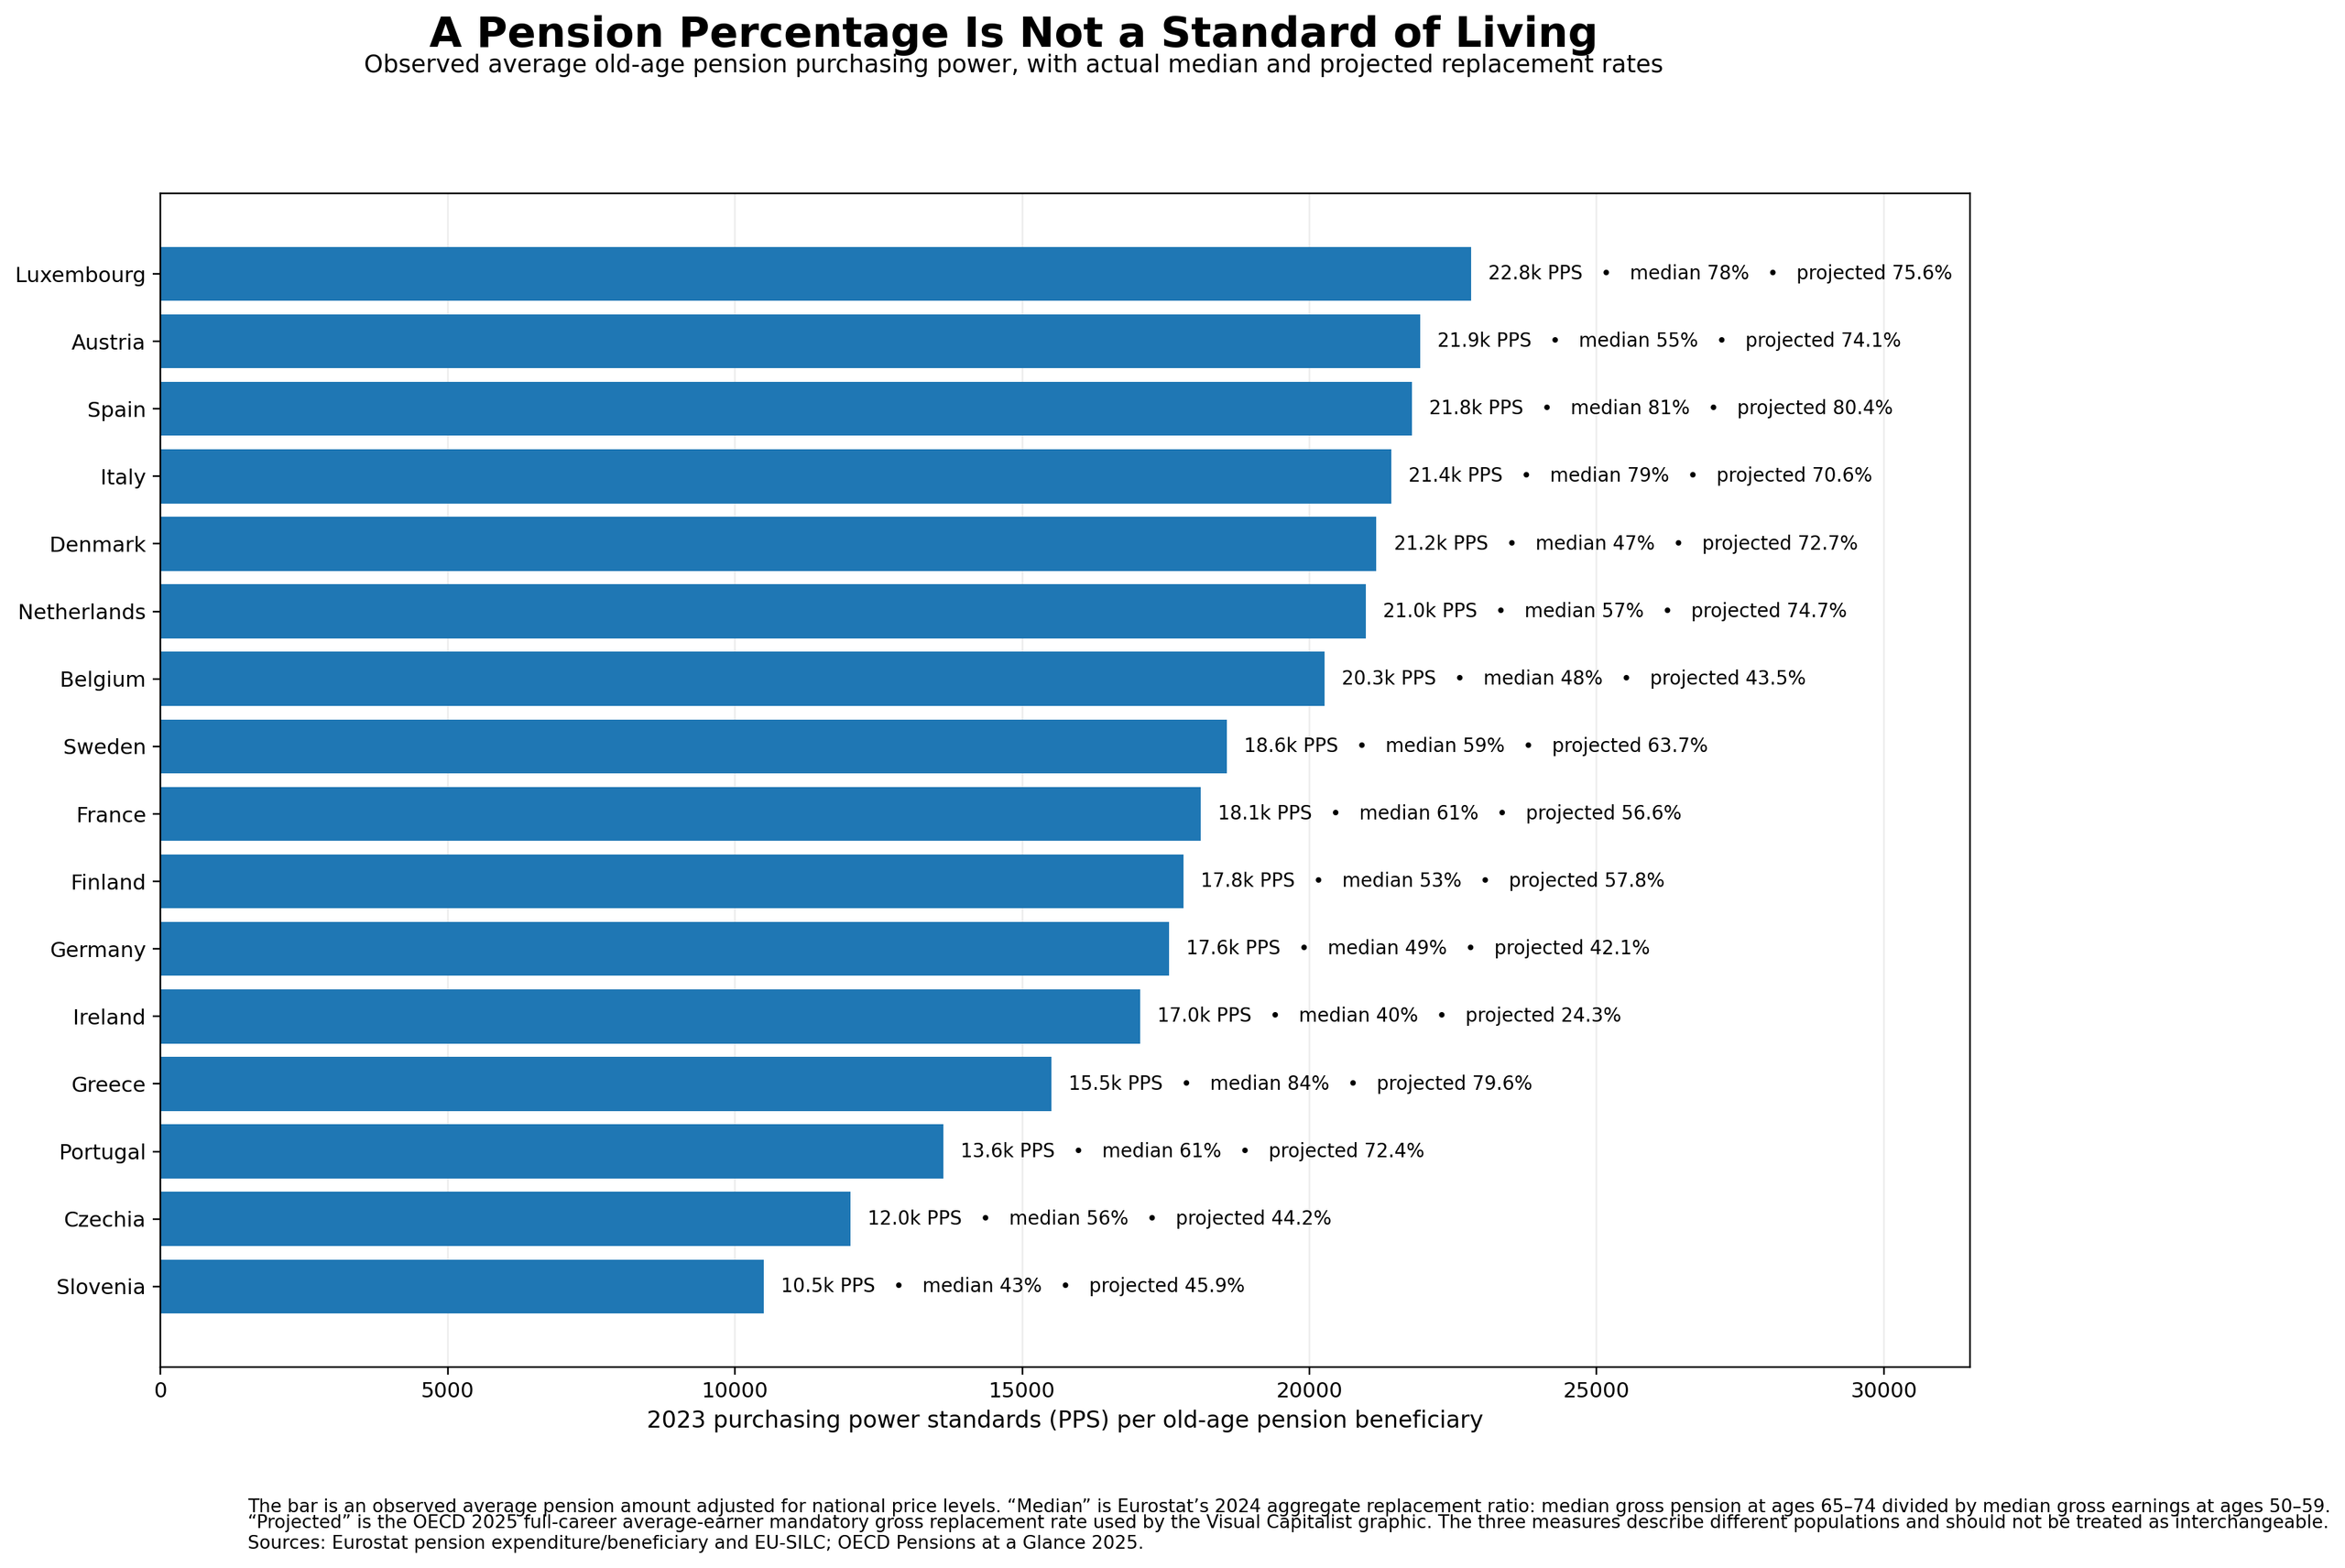
We can get closer to real retirees by looking at observed European pension data. Eurostat reports that the average gross annual old-age pension in the European Union was about €17,321 in 2023, or €1,443 per month. Across EU countries, average old-age pension expenditure per beneficiary ranged from roughly €4,500 in Bulgaria to €34,400 in Luxembourg. When adjusted for different national price levels, Luxembourg remained highest at roughly 22,800 purchasing power standards, or PPS.
The purchasing-power figures for several countries are particularly revealing:
| Country | Average old-age pension, PPS | OECD projected replacement rate |
|---|---|---|
| Luxembourg | 22,817 | 75.6% |
| Austria | 21,932 | 74.1% |
| Spain | 21,786 | 80.4% |
| Italy | 21,424 | 70.6% |
| Denmark | 21,169 | 72.7% |
| Netherlands | 20,988 | 74.7% |
| Germany | 17,554 | 42.1% |
| Greece | 15,508 | 79.6% |
| Portugal | 13,628 | 72.4% |
| Czechia | 12,016 | 44.2% |
The data come from Eurostat pension statistics compiled in a recent European pension comparison. Now Greece looks very different. Greece has almost the highest projected replacement rate in the OECD at 79.6%, but the observed average pension provides substantially less purchasing power than pensions in Denmark, the Netherlands, Austria, Italy, Spain or Luxembourg.
Medians reveal another problem
Averages can themselves mislead because a relatively small number of large pensions can pull the mean upward. For current European retirees, Eurostat therefore provides an aggregate replacement ratio based on the median gross pension received by people aged 65 to 74 divided by median gross earnings among people aged 50 to 59.
The 2024 results are revealing, Spain’s observed median ratio is about 81%, remarkably close to the OECD model’s projected 80.4%. Greece is about 84%, also consistent with the broad story told by the original graphic. But elsewhere the two measures wander apart. Denmark’s observed median ratio is only about 47%, compared with the OECD future-model rate of 72.7%. The Netherlands is 57% versus 74.7%. Austria is 55% versus 74.1%.
The United States gets an especially peculiar treatment
The United States deserves special attention because the methodology removes a large piece of the American retirement system. The 39.7% U.S. number covers mandatory retirement provision, essentially Social Security for this comparison. It deliberately excludes voluntary occupational and personal retirement saving. That means 401(k)s, IRAs and comparable voluntary retirement assets disappear from a chart that readers can easily interpret as comparing entire retirement systems. The OECD itself models the difference.
For a full-career average U.S. earner, its model gives a 39.7% gross replacement rate from mandatory provision alone. When its modeled voluntary retirement plan is included for a full career, the total rises to 74.8%. Even if voluntary saving begins only at age 35, the OECD estimates a U.S. replacement rate of about 63%.
Comparing America’s mandatory component with countries whose occupational retirement provision is mandatory or quasi-mandatory can make the U.S. system look artificially weak. The OECD identifies Belgium, Canada, Estonia, Germany, Ireland, Lithuania, New Zealand and the United States as countries where voluntary private pensions have sufficiently broad coverage to model them separately. So the chart is not really comparing complete national retirement systems. It’s comparing one particular layer of them.
What do American retirees actually receive?
Social Security provides a useful reality check. At the end of 2025, the average retired-worker Social Security benefit was $2,071.30 per month, while the median was $1,991.90. That works out to roughly $24,856 a year for the average and $23,903 for the median before considering 401(k) withdrawals, IRAs, defined-benefit pensions, investment income or employment. Those figures are not directly comparable with Eurostat’s European pension measure, which is exactly the problem with trying to compress multinational retirement systems into a single league table.