Cheap Is Not the Same as Livable: What the Visual Capitalist City Ranking Leaves Out
Visual Capitalist recently published an attractive chart titled “100 Global Cities by Quality of Life and Cost.” The graphic divides cities into categories such as “Best Value,” “Premium Life,” “Budget Living,” and “Bad Value.” At first glance, it makes intuitive sense. But there’s a big problem. Cheap is not the same thing as good value, and “quality of life” is not the same thing as overall desirability as a place to build a life.
The Visual Capitalist graphic is based on a visualization created by Valerii Emelianov using Numbeo data. Eighteen of the 100 cities displayed by Visual Capitalist fall into the below-median-cost, above-median-quality “Best Value” quadrant. The larger underlying analysis used Numbeo’s August 2026 data covering 306 cities. The results include places such as Porto, Valencia and Prague, which are entirely plausible choices. But the same methodology also puts Islamabad in the Best Value category alongside cities including Tokyo, Abu Dhabi, Bursa and Antalya? And Curitiba and Florianópolis in Brazil also make the group? Is that really “One of the best places in the world to live?”
What the chart measures
The underlying Numbeo Quality of Life Index incorporates purchasing power, safety, healthcare, housing affordability, commuting time, pollution and climate. Numbeo’s city tables show exactly those component indices. Those are useful variables, BUT…
Numbeo relies substantially on user-contributed data, and the creator of the graphic explicitly describes it that way. More importantly, Emelianov himself recognized one of the resulting problems. He wrote that seeing cities in Pakistan, Brazil or Türkiye among the best-value choices may be surprising because they can represent “isolated pockets of comfort for local elites and tourists” rather than conditions representative of the surrounding country and population. That’s putting it mildly.
If you’re a relatively wealthy professional living in an upscale Islamabad neighborhood, you may have a modern apartment, private transportation, private healthcare, inexpensive restaurants and domestic help. If you’re asked about the quality of life the answers may be quite good. That doesn’t tell us whether Islamabad belongs in the same global relocation category as Prague or Porto. It tells us that a relatively affluent person can construct what they consider a pleasant life there at low cost.
The chart has no economic-opportunity dimension
This is probably its biggest economic weakness, consider Islamabad and Prague. Pakistan’s 2025 GDP per capita was approximately $1,596, according to the World Bank. Czechia’s was approximately $35,917. Portugal was about $32,082, Spain approximately $38,627, while Türkiye was roughly $18,599. GDP per capita obviously does not determine an individual’s happiness, and national GDP is an imperfect proxy for the economy of a particular city. But a difference of more than an order of magnitude is not statistical noise.
The economic system surrounding the city: productivity, wages, tax base, purchasing power, infrastructure capacity and the range of economic opportunities available to residents will affect everyone’s quality of life in that city. The same problem appears at the expensive end of the Visual Capitalist graphic. New York, London, San Francisco and Los Angeles are characterized as poor value because they combine high costs with comparatively disappointing Numbeo quality-of-life scores. The creator specifically identifies these large migration magnets as frequently offering poor value. But there’s a reason millions of ambitious people have historically moved to New York, London and San Francisco instead of optimizing their lives around cheap restaurant meals and inexpensive apartments. Opportunity has value.
A software engineer, financier, entrepreneur, scientist, physician or artist may rationally accept a significantly higher cost of living in return for a labor market, customer base, professional network or concentration of capital that does not exist in a cheaper city. A city-ranking methodology that counts the rent but not the career the rent gives you access to has omitted half of the economic equation.
“Cheap” is also the market price of risk
There’s another basic economic problem with treating low prices as automatically desirable; prices contain information. A city is inexpensive because housing construction is abundant and efficient which is a good thing, but a city can also be inexpensive because local wages are low, people are leaving, investment is weak, the currency has depreciated, inflation has damaged purchasing power, institutions are unreliable, crime is high or geopolitical risk is substantial. You don’t want to live there, there’s a reason people are leaving. In those situations, cheapness isn’t a bargain. It’s a risk discount.
Türkiye demonstrates the point. World Bank data put Turkish GDP per capita at about $18,599 in 2025, with unemployment around 8.5% and consumer-price inflation still running at an extraordinary 34.9%. Yet Bursa and Antalya appear among the chart’s Best Value cities. Maybe they offer an enjoyable lifestyle, particularly to someone earning dollars or euros remotely. But 35% inflation is not a footnote in a serious analysis of economic quality of life. It affects savings, wages, rents, business planning and household purchasing power. A retiree receiving a U.S. pension and a local worker earning Turkish lira aren’t experiencing the same “value.”
Security gets a veto
Pakistan is currently under a Level 3: Reconsider Travel advisory from the U.S. State Department because of armed conflict, terrorism, crime and kidnapping. The advisory specifically notes that terrorist attacks have occurred in Islamabad as well as other major Pakistani cities. That doesn’t mean every person in Islamabad is in constant danger, although a rich foreigner is going to be considered a high value target. Risk belongs in any serious global livability comparison.
Brazil presents a different problem. It is currently Level 2, with crime and kidnapping cited as risks. The State Department warns that violent crime including murder, armed robbery and carjacking occurs in urban areas. There is also objective crime data supporting a meaningful difference. World Bank/UN data put Brazil’s 2023 intentional-homicide rate at approximately 19 per 100,000 people, compared with roughly 1 in Portugal and Czechia and about 4 in Pakistan. These are national rather than city-specific figures, so they should be treated as screening variables rather than city crime rates.
Then there’s Russian cities on the list. The same visualization has generated considerable debate over the favorable placement of Kaliningrad. Russia remains under a Level 4: Do Not Travel U.S. advisory amid the Russia-Ukraine war and risks including wrongful detention and severely constrained consular assistance. Russia’s economic indicators aren’t disastrous in conventional unemployment terms, but 2025 GDP growth was only 1.0%, inflation was 8.7%, and net migration was approximately -252,000. They’re giving houses away in Russia, they have plenty to spare.
A ranking can mathematically conclude that a Russian city has pleasant traffic, reasonable healthcare, low prices and nice weather. That doesn’t mean an American considering an international relocation should treat it as equivalent to Prague, if you’re a veteran, things also might night go so well.
A better city index
This is where I would build the analysis differently.
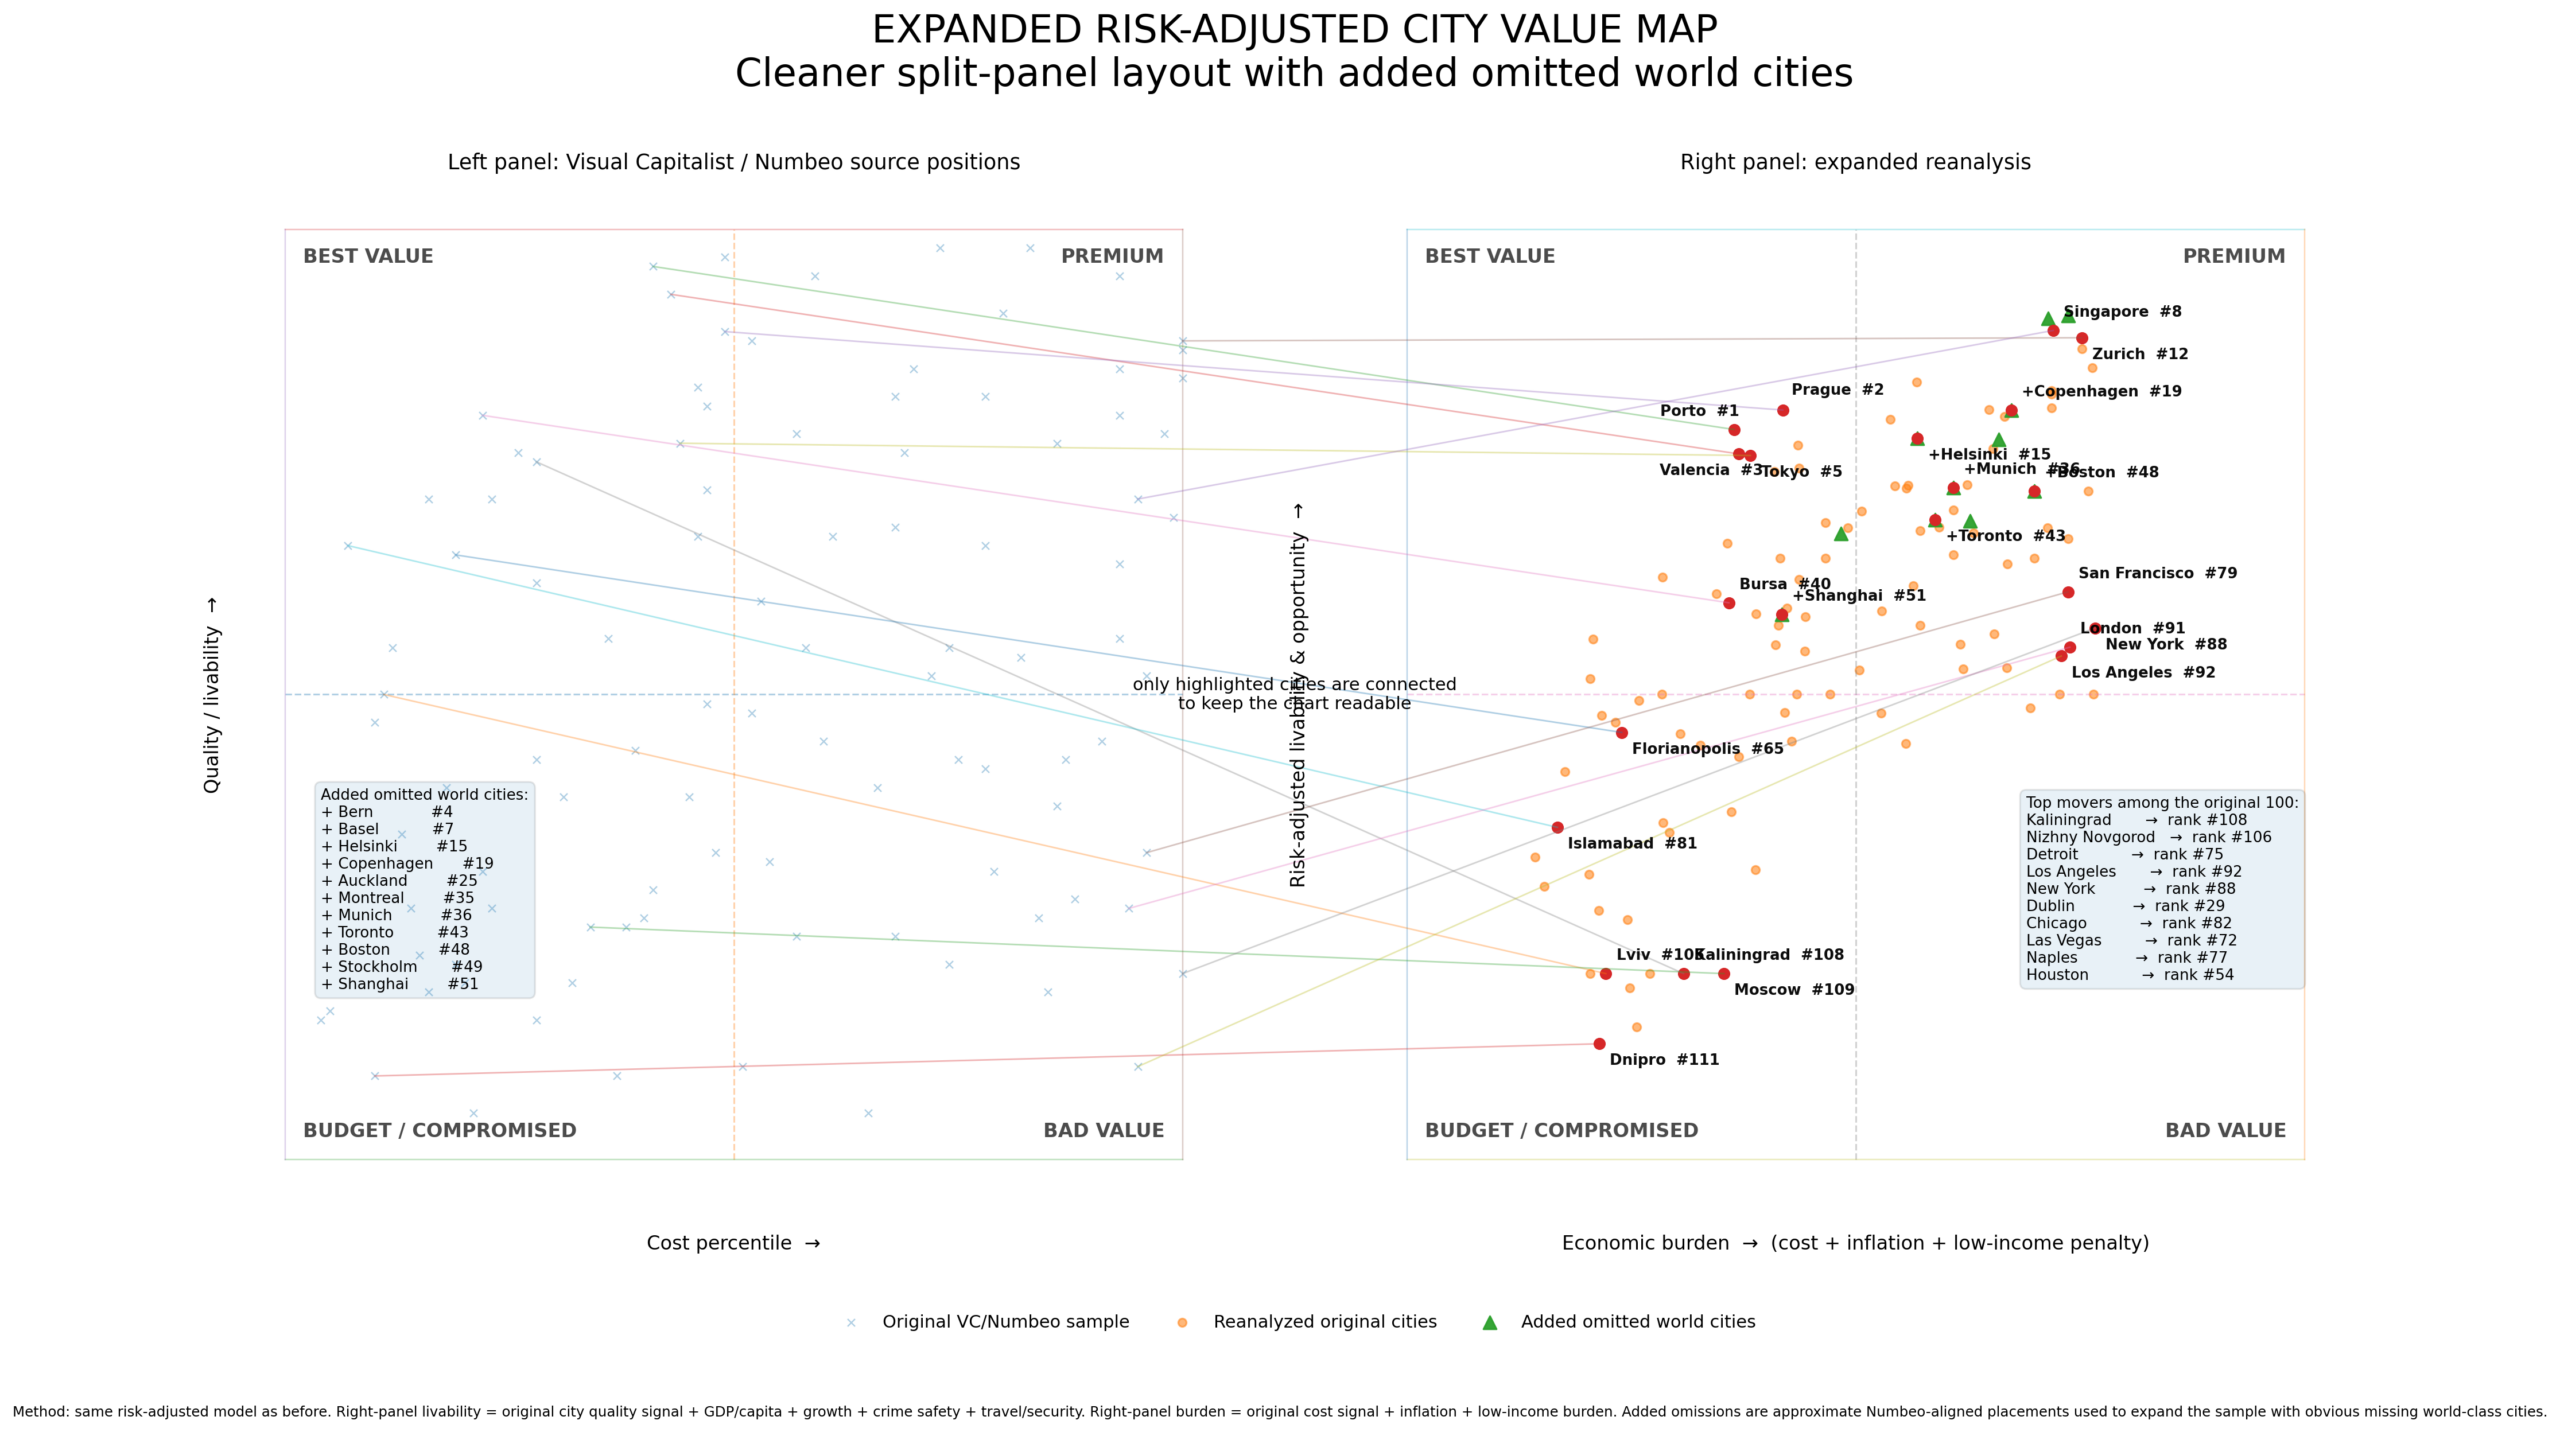
Instead of a Cost of Living versus Quality of Life chart, We constructed a Risk-Adjusted Livability and Opportunity Index. The exact weights are debatable, but at least the assumptions would be explicit.
| Component | Weight | What we measured |
|---|---|---|
| Everyday quality of life | 20% | Healthcare, pollution, commute, environment, recreation |
| Economic opportunity | 20% | GDP per capita, local wages, unemployment, job-market depth, productivity and growth |
| Public safety | 15% | Homicide, violent crime, property crime and credible city-level crime statistics |
| Geopolitical/institutional stability | 15% | War, terrorism, civil disorder, rule of law, sanctions, arbitrary detention and capital restrictions |
| Affordability | 15% | Housing and ordinary expenses relative to local after-tax income |
| Infrastructure/human capital | 10% | Power, water, internet, transportation, airports, schools and universities |
| Economic and demographic trajectory | 5% | Population movement, investment, real-income growth, fiscal conditions and whether conditions are improving or deteriorating |
We also imposed several hard gates. A city located in an active conflict environment or a country under a Level 4 Do Not Travel advisory could not qualify for a “Best Place to Live” category regardless of how cheap its restaurants or apartments are. Level 3 would impose a major penalty. Extremely high violent crime or persistent double-digit inflation would likewise prevent a city from receiving a top rating without an extraordinary offsetting reason.
If a house costs 30% less because it is sitting next to a wildfire, you don’t call the house an incredible bargain and put wildfire risk in a footnote, unless you’re a real estate agent with a serious cash flow problem.
What happens to the Visual Capitalist “Best Value” cities?
Applying even this simple screening process dramatically changes the interpretation. The figures below are primarily country-level indicators used as proxies. A lot of value disappears when the analysis is limited to cost and Numbeo quality-of-life responses.
| City | Country GDP/capita, 2025 | Unemployment | Inflation | Security/economic adjustment | My assessment |
|---|---|---|---|---|---|
| Prague | $35,917 | 2.8% | 2.5% | Strong economy, low national homicide | Strong Best Value candidate |
| Porto | $32,082 | 6.2% | 2.3% | Developed economy, low national homicide | Strong Best Value candidate |
| Valencia | $38,627 | 10.4% | 2.7% | Strong national income; weak Spanish labor-market indicator | Good, with opportunity caveat |
| Split | $27,104 | 5.0% | 3.7% | Low violent-crime environment; healthy recent growth | Plausible Best Value candidate |
| Plovdiv | $20,328 | 3.5% | 4.6% | Lower incomes but relatively favorable macro indicators | Plausible value candidate |
| Bursa / Antalya | $18,599 | 8.5% | 34.9% | High inflation plus elevated geopolitical/security considerations | Significant discount required |
| Curitiba / Florianópolis | $10,713 | 6.0% | 5.0% | Brazil homicide rate ~19/100k; Level 2 crime/kidnapping advisory | Lifestyle appeal, but material safety discount |
| Islamabad | $1,596 | 5.4% | 3.5% | Level 3: armed conflict, terrorism, crime and kidnapping | Does not pass a general Best Value screen |
| Russian cities such as Kaliningrad | $17,547 | 2.1% | 8.7% | Level 4 advisory, war-related and institutional risk | Fails a general Best Value screen |
Economic figures are from the World Bank’s latest 2025 country data. This produces a result that passes a much more basic common-sense test. Prague and Porto still look very good. The European mid-sized cities identified by the original graphic may be among its strongest findings.
But Islamabad no longer sits comfortably in the same category simply because upscale residents report good living conditions at very low nominal prices. Brazil’s attractive southern cities remain interesting, but their safety environment gets priced in. Turkish cities remain potentially excellent choices for a foreign retiree or dollar-paid remote worker, but persistent inflation and institutional risk prevent the low sticker price from being mistaken for universally superior economics. Cities subject to severe conflict or geopolitical restrictions don’t get to overcome that fact by earning enough points for climate, healthcare or cheap rent.
Data note: GDP per capita, growth, unemployment and inflation figures referenced above are the latest World Bank country-level values available for 2025. Crime figures are national-level screening variables and should not be interpreted as city-specific crime rates. U.S. State Department travel advisories are used as one standardized geopolitical/security indicator rather than as a complete judgment about everyday life for every resident. Numbeo remains useful as a source of crowdsourced local-condition data; the argument here is that it should be one component of a broader model rather than the model itself.