Public debates about crime often focus on punishment, as crime increases the political response is predictable: increase the sentence. Five years becomes seven, ten becomes fifteen, mandatory minimums get longer. There’s an intuitive logic behind this: if crime becomes more expensive, people should commit less of it.
Economist Gary Becker formalized essentially that idea in his famous Crime and Punishment: An Economic Approach. But Becker’s model contains another variable that is at least as important as the punishment itself: the probability of actually being caught and punished. Modern criminological research suggests that this second variable may be the more important one.
If policymakers have a limited amount of money available to reduce crime (when do they not?), spending it on investigations, police presence, evidence processing, cameras, detectives and other methods that increase the probability of apprehension may deter more crime than simply adding years to prison sentences. There is a third possibility worth examining: increase both certainty and punishment together. That hybrid strategy produces some interesting results.
Becker’s Criminal Is an Economic Decision-Maker
Becker’s basic argument was not that criminals literally carry calculators, he proposed that criminal behavior could be analyzed using the same economic framework applied to other human decisions. An individual commits an offense when the expected benefit exceeds the expected cost and exceeds what that individual could obtain from alternative legal or illegal activities.
In simplified form: Expected Cost of Crime ≈ P(punishment) × Severity of punishment
Becker explicitly modeled criminal behavior as responding negatively to both the probability of conviction and the punishment imposed after conviction. Suppose a criminal thinks there is a 10% chance of receiving a five-year prison sentence.
A crude Becker calculation gives: 0.10 × 5 years = 0.5 expected years of punishment
Call that 0.5 expected years of punishment exposure.
Now consider two policies: Double the sentence: 0.10 × 10 years = 1.0 expected years
Or double the probability of punishment: 0.20 × 5 years = 1.0 expected years
In a simple risk-neutral economic model, they appear equivalent, but human beings aren’t perfectly risk-neutral calculators, and that’s where the empirical evidence becomes important.
Certainty Appears to Matter More Than Severity
The National Institute of Justice summarizes decades of deterrence research with a remarkably strong conclusion: the certainty of being caught is a substantially more powerful deterrent than increasing the severity of punishment.
NIJ notes that increasing already-long prison sentences generally produces, at best, modest additional deterrence. Police activity can deter crime more effectively when it increases an offender’s perception that he is likely to be caught. One reason increasing statutory penalties performs poorly is straightforward: many offenders have little knowledge of the exact punishment associated with a crime. National Institute of Justice
The psychology is: a would-be car thief probably doesn’t know whether the sentencing range was increased by the legislature from five years to seven. But he can see a police cruiser, cameras, and he knows whether other thieves in his circle have recently been arrested. He knows whether stolen vehicles in a particular city routinely disappear without anyone being caught. That information is immediate and understandable, the statutory sentencing table isn’t.
The Real Criminal-Justice Funnel Is Surprisingly Wide
There’s another problem with relying primarily on long sentences: a severe punishment cannot deter someone who believes the probability of receiving it is extremely small. For motor-vehicle theft, the Bureau of Justice Statistics estimated that 75% of motor-vehicle theft victimizations were reported to police in 2024. Burglary was reported only about 40.7% of the time. Robbery was reported about 73.4% of the time. Bureau of Justice Statistics
Reporting is only the first stage, in FBI statistics for 2024, police cleared approximately 9.2% of reported motor-vehicle thefts, compared with 15.2% of burglaries and 30.4% of robberies. A clearance generally means the offense was cleared by arrest or exceptional means. It doesn’t mean that the offender was ultimately convicted or imprisoned. CDE UCR CJIS
For a rough illustration, combine the motor-vehicle-theft numbers: P(reported) = 0.75
and P(cleared | reported) = 0.092
giving: 0.75 × 0.092 = 0.069, or 6.9%. Only about 6.9% of victimizations reach even the clearance stage under this very simplified calculation. And clearance is still upstream from prosecution, conviction and incarceration. So the actual probability that any single car theft produces a substantial prison sentence is lower still.
A Simple Risk-versus-Reward Experiment
Let’s construct an intentionally simplified experiment. Assume a motor-vehicle thief faces the current approximate 6.9% report-and-clearance probability calculated above. For purposes of illustration, assume that the eventual punishment associated with being caught is equivalent to three years in prison.
Our baseline Becker-style deterrence index becomes: 0.069 × 3 years = 0.207 expected years. That equals about: 0.207 × 12 = 2.5 expected months. 2.5 months of expected punishment exposure per offense. This isn’t a prediction that an offender literally expects to serve 2.5 months, it’s a comparative index. Running some experiments:
| Policy | Effective clearance proxy | Illustrative punishment | Becker exposure index | Relative to baseline |
|---|---|---|---|---|
| Current baseline | 6.9% | 3 years | 0.207 years | 1.0× |
| Double sentence | 6.9% | 6 years | 0.414 years | 2.0× |
| Double clearance | 13.8% | 3 years | 0.414 years | 2.0× |
| Double both | 13.8% | 6 years | 0.828 years | 4.0× |
Something interesting happens: in Becker’s pure mathematical model, doubling the probability and doubling the punishment individually produce exactly the same result. Both double expected punishment, but doubling both simultaneously quadruples it. That’s the hybrid case.
Why the Two 2× Policies Probably Aren’t Really Equal
The simple equations say that these two policies are equivalent:
Policy A: 0.069 × 6 years = 0.414 expected years
Policy B: 0.138 × 3 years = 0.414 expected years
Decades of deterrence research suggest offenders aren’t likely to experience them as equivalent. Policy A says: You’re still probably not going to get caught, but if you do, the punishment will be worse. Policy B says: Your chances of getting caught just doubled. NIJ’s review concludes that increasing already lengthy sentences produces relatively little additional deterrence, while increasing perceived certainty of apprehension has a substantially stronger effect. National Institute of Justice
The Hybrid Case
Now consider the fourth scenario: improve enforcement enough to approximately double the probability of reaching the clearance stage while also doubling the punishment from three hypothetical years to six. The simplified expected-sanction calculation becomes: 0.138 × 6 years = 0.828 expected years or roughly 9.9 months of expected punishment exposure, compared with about 2.5 months under the baseline, a fourfold increase. The result illustrates something that can disappear in political arguments about being either “tough on crime” or focused on policing reform. A rational deterrence strategy should contain both.
Spend the First Dollar on Certainty
Suppose a jurisdiction already imposes a substantial sentence for auto theft. Increasing the maximum from six years to eight years may sound tough, but it accomplishes very little if potential offenders believe their chance of apprehension is close to zero. Put the same resources into better investigations, rapid license-plate-camera follow-up, forensic processing, prosecutors capable of handling cases promptly, focused policing, coordination among jurisdictions and dismantling organized theft networks, and the perceived risk of committing the offense may change considerably.
A system in which nearly everyone is caught but punishment is trivial would also produce poor incentives. The better formulation is: Deterrence ≈ Meaningful Punishment × Credible Probability of Receiving It
There Is Also an Incapacitation Effect
Deterrence shouldn’t be confused with incapacitation. Someone already in prison cannot steal another car from the street during that period. Longer sentences therefore can prevent crimes through incapacitation even when they produce little additional deterrence among people who have not yet been caught. NIJ specifically distinguishes these effects. Prison can punish and incapacitate even when marginal increases in sentence length do relatively little to discourage potential offenders. National Institute of Justice That provides a stronger case for longer imprisonment among certain high-rate or dangerous repeat offenders than among offenders in general. But it’s a different argument.
Becker Was More Right Than He Was Wrong
Becker wrote his analysis decades before modern crime databases, behavioral economics and much of today’s deterrence literature existed, yet one of his central insights has survived extraordinarily well. He recognized that the offender’s probability of conviction matters independently from the punishment received upon conviction. Becker also discussed the observation that criminal behavior appeared more responsive to changes in probability than to changes in punishment severity.
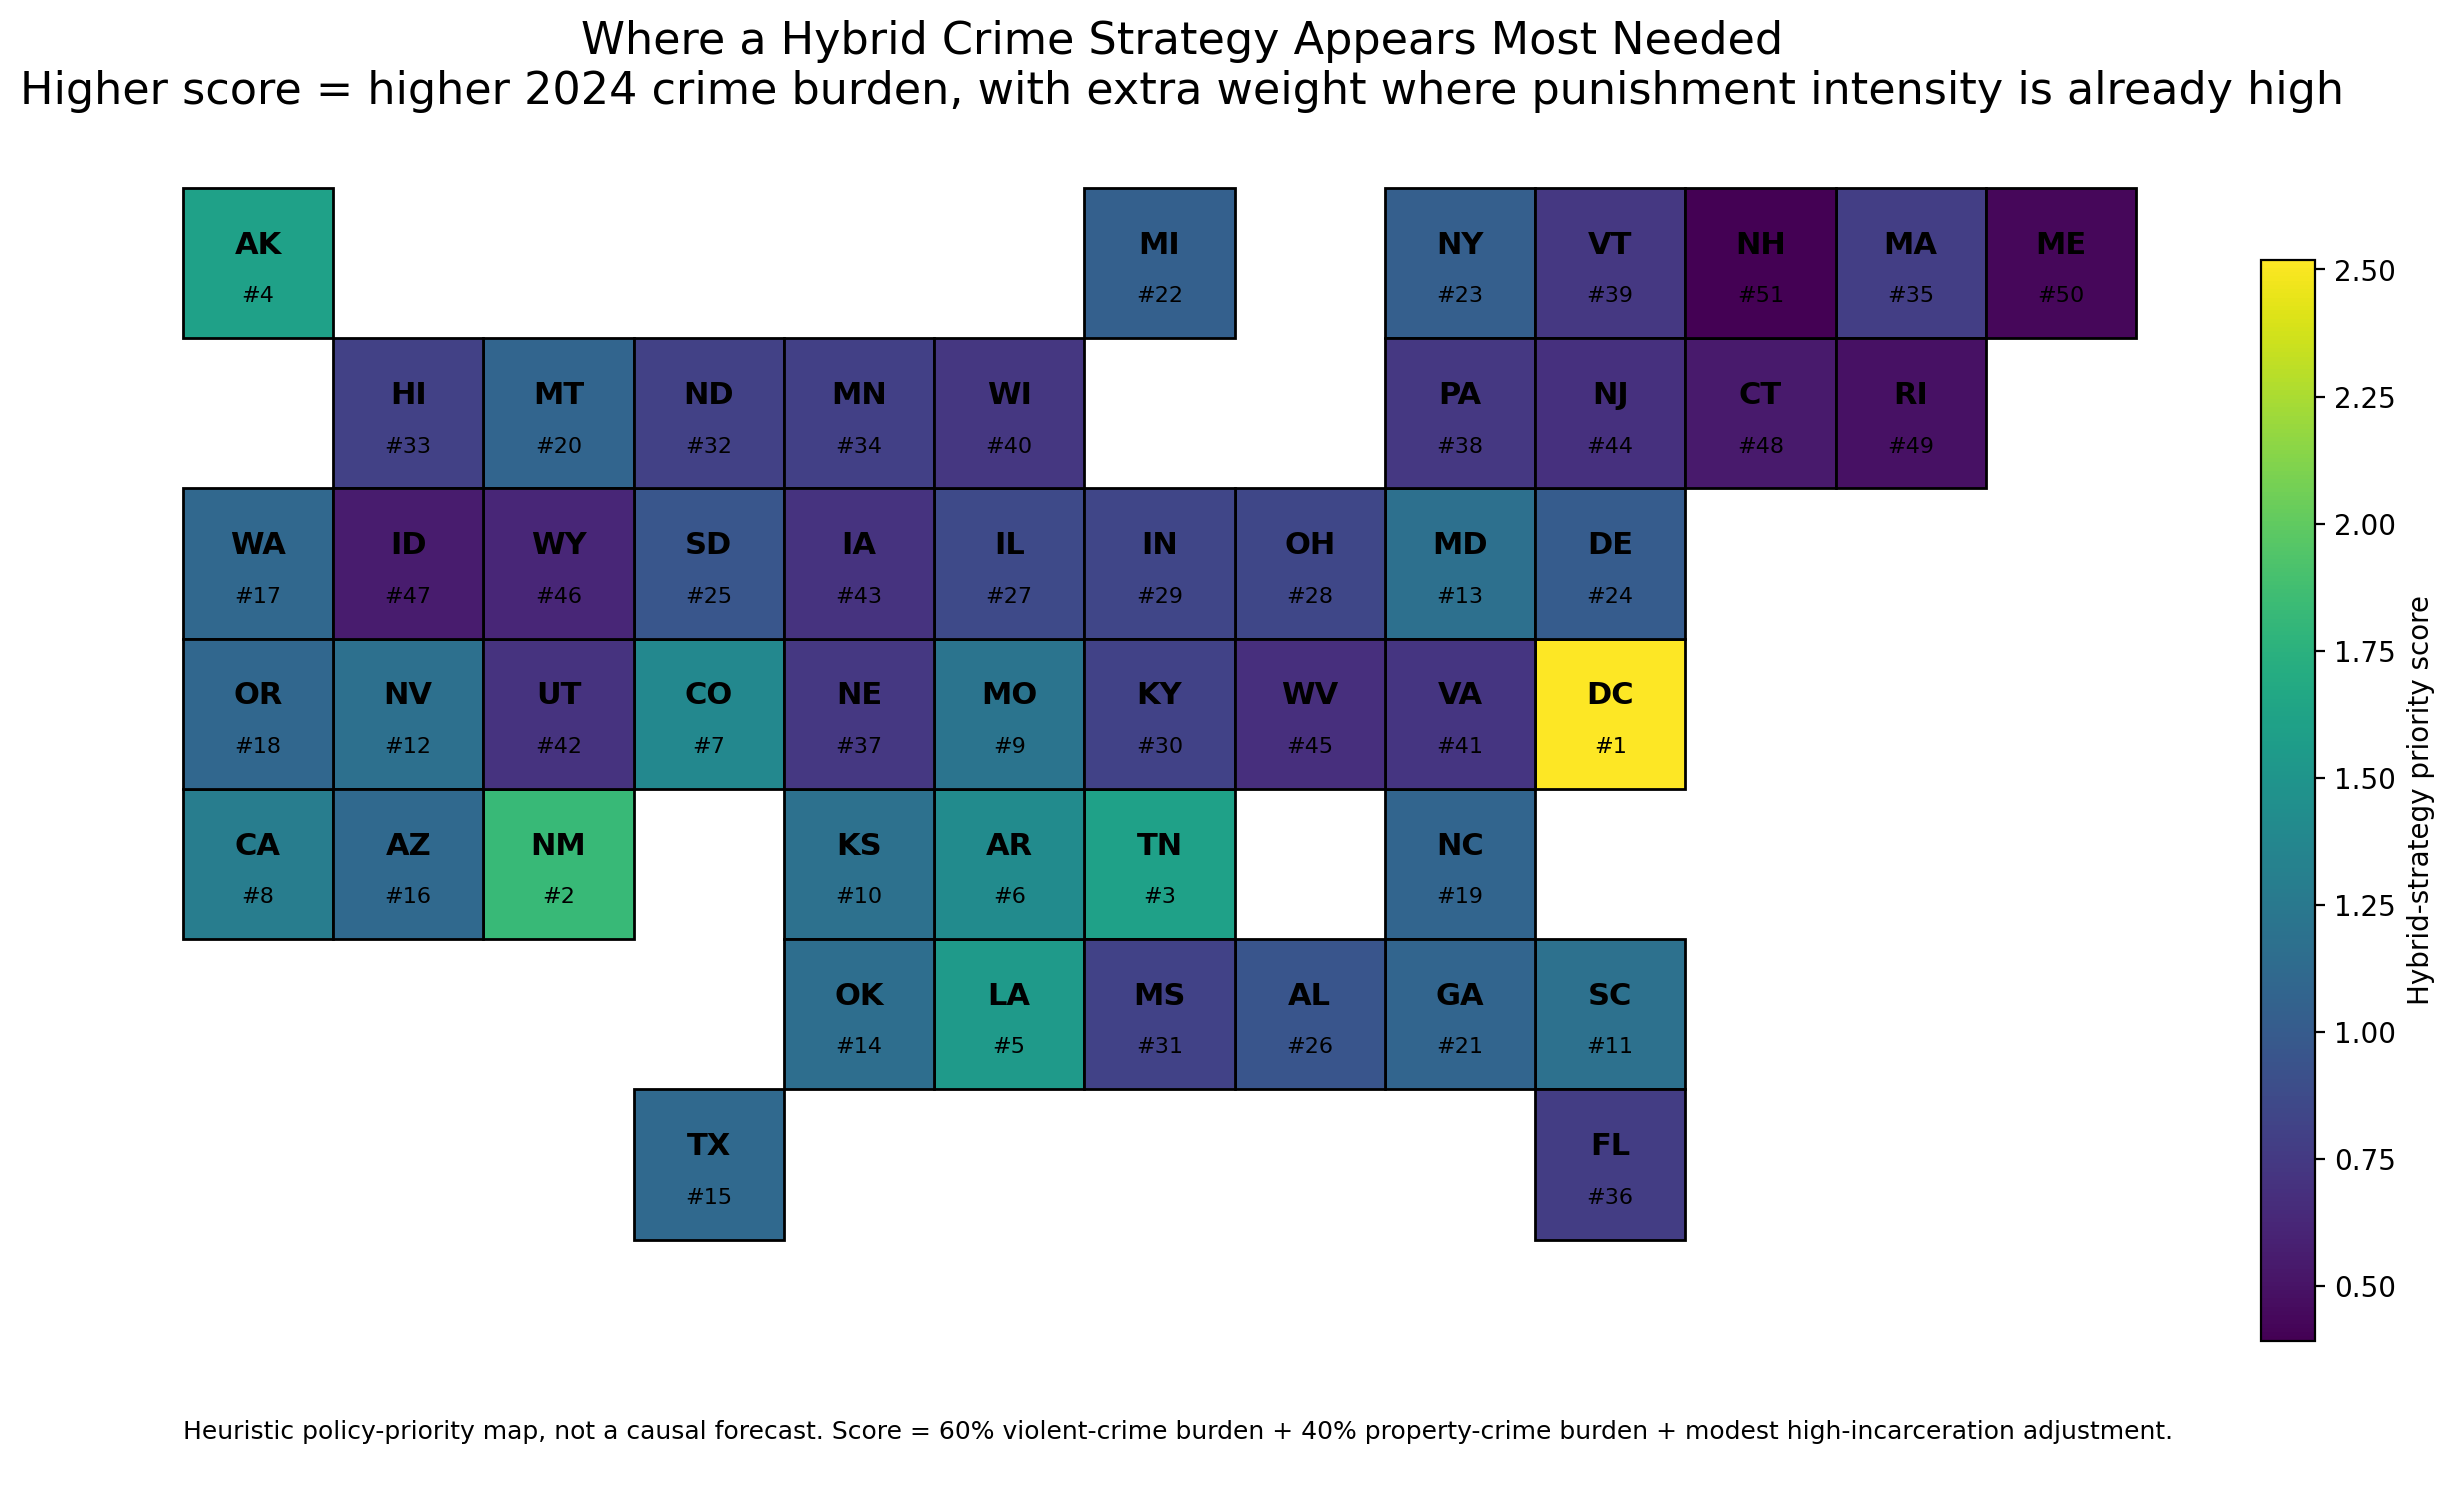
The Map
The map you see above is an illustrative hybrid-priority map showing where a combined strategy of higher capture/clearance effort plus meaningful punishment appears most needed.
The takeaways:
- Certainty is still the weak link nationally.
The FBI’s 2024 summary reports that 43.8% of violent crimes and only 15.9% of property crimes were cleared by arrest or exceptional means. That is the core reason Becker-style deterrence often works better through higher capture rates than through simply adding years to sentences. - Some states already punish heavily, yet still have high crime burdens.
The Bureau of Justice Statistics reported the highest 2024 jail incarceration rates in Louisiana (670 per 100,000), Kentucky (457), Mississippi (446), Georgia (388), and Tennessee (376).
When a state is already on the high-punishment side and still has a high crime burden, that is a strong sign that “add more years” alone is probably not the highest-return move. - The strongest hybrid cases are places where crime is high and punishment is already nontrivial.
In the model I used, the top hybrid-priority jurisdictions came out as:- District of Columbia
- New Mexico
- Tennessee
- Alaska
- Louisiana
- The western property-crime states also stand out.
States like New Mexico, Colorado, Washington, Oregon, and Nevada show large property-crime burdens in the FBI-derived state-rate table, which makes them good candidates for a stronger capture/clearance push, especially for burglary, theft, and vehicle crime.
Because the browsed federal sources did not provide one clean, comparable state-by-state clearance table in the same easy format as the state crime-rate table, I used this framework:
- National clearance baseline: FBI 2024 clearances
- Violent crime: 43.8%
- Property crime: 15.9%
- State crime burden: 2024 state violent/property crime rates from a table that explicitly identifies FBI Crime Data Explorer as its source.
- Punishment proxy: BJS 2024 jail-incarceration-rate leaders, used as a rough proxy for already-high punishment intensity.
So the map is not a precise forecast. It is a policy-priority map. The map’s score is driven by:
- 60% violent-crime burden
- 40% property-crime burden
- plus a small extra bump for states already in the highest jail-incarceration group
That means the darkest states are places where:
- crime is high enough that doing nothing is expensive,
- and/or the state already punishes heavily enough that clearance/capture improvements should probably get more attention.
What the hybrid scenario means
For the table behind the map, I used an illustrative hybrid scenario, not a claim of exact future outcomes:
- assume a meaningful improvement in capture/clearance effort
- plus a modest increase in effective punishment severity
Then I translated that into a simple demonstration effect:
- violent crime rate: about 10% lower
- property crime rate: about 8% lower
So for example, under that illustrative scenario:
- New Mexico violent rate: 717.1 → 645.4
- Tennessee violent rate: 592.3 → 533.1
- Louisiana violent rate: 519.8 → 467.8
- Colorado property rate: 2592.8 → 2385.4
Those are scenario outputs, not measured forecasts.
Policy interpretation
If I were converting this into a practical policy memo, I’d say:
- Louisiana and Tennessee: best evidence for a hybrid strategy, because punishment is already high and crime is still high.
- New Mexico and Alaska: severe crime burden suggests strong gains from better certainty/capture, with punishment changes as support rather than the primary lever.
- Colorado, Washington, Oregon, Nevada: property-crime-heavy states where better clearance probably matters more than adding sentence length.
- Georgia, Kentucky, Mississippi: already-high incarceration intensity is a caution against assuming that harsher sentencing alone is the solution.
Sources
Gary Becker, Crime and Punishment: An Economic Approach, in Essays in the Economics of Crime and Punishment, NBER.
Bureau of Justice Statistics, Criminal Victimization, 2024. In 2024, BJS estimated that 73.4% of robbery victimizations, 40.7% of burglaries and 75.0% of motor-vehicle thefts were reported to police. Bureau of Justice Statistics
Federal Bureau of Investigation, Crime in the United States, 2024. FBI data show clearances of 30.4% for robbery, 15.2% for burglary and 9.2% for motor-vehicle theft among reported offenses. CDE UCR CJIS
National Institute of Justice, Five Things About Deterrence. NIJ summarizes the research literature as finding certainty of apprehension considerably more effective for deterrence than increases in punishment severity. National Institute of Justice