What the homeownership chart really tells us
The chart’s lesson that Slovakia has a healthier housing market than Switzerland, Germany, or Denmark might be misleading. Homeownership rates are partly archaeological evidence. They preserve the effects of communist-era privatization, subsidized apartment sales, inheritance patterns, mortgage institutions, tax policy, rental protections, and population aging.
Visual Capitalist places Slovakia, Romania, Croatia, China, Lithuania, Bulgaria, and Poland near the top, while Germany, Switzerland, Austria, Denmark, and the Netherlands sit near the bottom. But that ranking measures housing tenure, not affordability, construction quality, household debt, availability for first-time buyers, or the cost of living near productive jobs. (visualcapitalist.com)
First, the Visual Capitalist chart has comparability problems
The underlying OECD data generally measure the share of households owning their homes, either outright or with a mortgage. Some countries classify cooperatives, social rentals, or subsidized housing differently. The observations also come from different years, with several major countries represented by data from 2018 through 2021 rather than a single synchronized year. (OECD)
Two warning lights are especially bright:
- Japan appears at 84% in the chart, but Japan’s official 2023 Housing and Land Survey reports an owner-occupied rate of 60.9%. The OECD series uses a different Japanese panel dataset, so Japan’s placement should be treated as a source and sampling discrepancy, not a clean international comparison. (Statistics Bureau of Japan)
- The chart gives the European Union 72.5%, while Eurostat reports that 68.4% of the EU population lived in owner-occupied housing in 2024. Those are different denominators and possibly different reference years. The EU is also an aggregate inserted among individual countries. (European Commission)
So the exact order is less trustworthy than the broad institutional patterns.
“Homeowner” can mean two radically different things
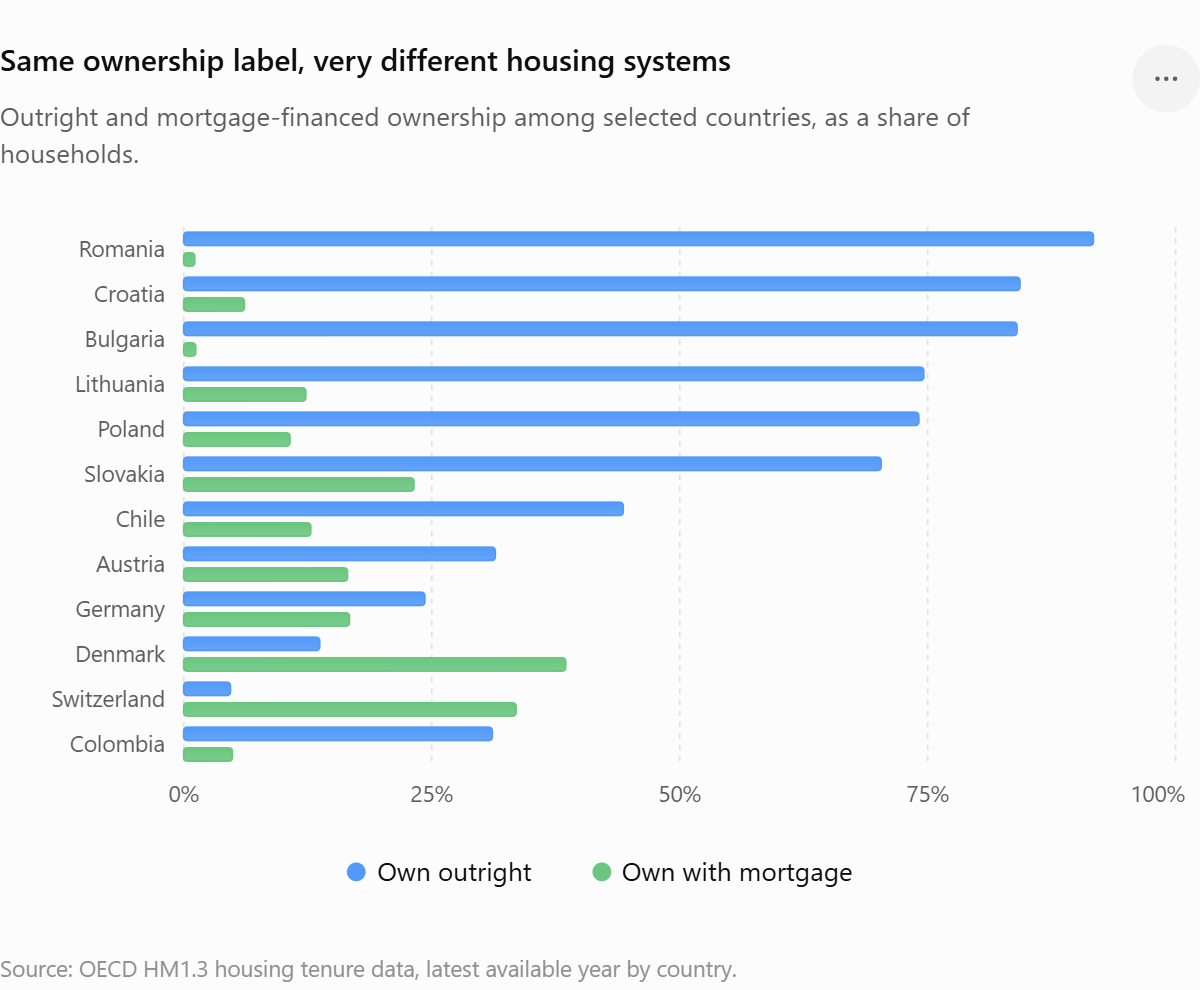
The composition of ownership exposes the hidden machinery. Eastern European ownership is overwhelmingly outright, while Nordic and Anglo-American ownership is much more mortgage-dependent.
That difference matters enormously:
- A Romanian household that received or cheaply purchased an apartment during privatization is counted the same as an Icelandic household carrying a large variable-rate mortgage.
- A country can have high ownership and poor housing mobility, deteriorating buildings, overcrowding, or almost no rental market.
- A country can have low ownership yet provide secure, high-quality long-term rental housing.
The OECD data show that Romania, Croatia, Bulgaria, Lithuania, and Poland have very high outright ownership, while countries such as Iceland, Norway, the Netherlands, Sweden, Canada, Denmark, and the United States rely much more heavily on mortgage-financed ownership. (statranker.org)
The basic price mechanism
A useful simplification is:
Housing demand pressure × supply rigidity × available credit = price escalation
Each part plays a different role.
Immigration and population growth increase the number of households looking for housing. But immigration does not mechanically create a crisis. A systematic review commissioned by the UK Migration Advisory Committee found that a one-percentage-point increase in the immigrant share of an area was generally associated with a roughly zero-to-three-percent increase in house prices, with typical estimates below one percent. The effects were larger where construction was slow or planning restrictions made supply unresponsive. (GOV.UK)
Building and land-use regulations determine whether demand produces new homes or simply bids up existing ones. OECD research finds that stricter land-use regulation is associated with less responsive housing supply, especially in productive cities where jobs and population are expanding. That doesn’t mean fire codes or structural standards are the villain. The biggest bottlenecks are usually discretionary zoning, height and density limits, lengthy appeals, infrastructure delays, fragmented local approval, and restrictions on converting land to residential use. (OECD)
Easy credit determines how much money buyers can throw into the same constrained auction. Lower interest rates, higher loan-to-value ratios, longer mortgage terms, government guarantees, and tax-favored borrowing enlarge purchasing power. When construction can’t respond, much of that additional credit is capitalized into land and existing-home prices. BIS research finds that monetary policy has a stronger effect on house prices where housing supply is less elastic. (Bank for International Settlements)
This is why demand subsidies frequently betray their own purpose. Mortgage-interest deductions, first-buyer grants, subsidized loans, and guarantees may help the first group of recipients, but under constrained supply they can raise the market-clearing price for everyone behind them. OECD research describes mortgage-interest relief as both regressive and ineffective as a broad tool for increasing ownership. (OECD)
Country and regional patterns
1. Eastern Europe: high ownership created by privatization
The extraordinary rates in Slovakia, Romania, Croatia, Lithuania, Bulgaria, Poland, Latvia, Estonia, Slovenia, and Czechia are primarily a legacy of the transition from communism.
During the 1990s, governments sold or transferred state-owned apartments to their occupants, often at deeply discounted prices. That created millions of outright owners almost overnight while leaving relatively small professional and social rental sectors. (webfs.oecd.org)
Their high rates therefore do not prove that these countries recently built abundant affordable housing. In many cases:
- The ownership was inherited from a one-time political transformation.
- Younger households may still struggle to enter the market.
- People can own homes in declining towns while employment is concentrated in expensive capitals.
- Weak rental markets make it difficult to move for work.
- Apartment blocks may require costly renovation even though the occupants have no mortgage.
Immigration isn’t the principal explanation for these countries’ high ownership rates. Some have historically experienced emigration rather than large net inflows. Their ranking is mostly institutional history frozen into concrete.
2. China: privatization plus a property-centered savings system
China’s roughly 90% figure also reflects a major privatization episode. During the 1990s, urban residents were allowed to purchase state-owned apartments, frequently at subsidized prices. (LinkedIn)
Later, homeownership was reinforced by several distinctive forces:
- Limited attractive household investment alternatives
- Strong cultural and marriage-market pressure to own
- Local-government reliance on land sales
- Rapid urbanization and internal migration
- Extensive presale financing and developer leverage
China therefore demonstrates that very high ownership can coexist with severe affordability problems, speculative construction, vacant units, developer failures, and geographic mismatch. A household owning an apartment in a lower-tier city does little to reduce the price of housing near jobs in Shenzhen or Shanghai.
3. Canada, Australia, New Zealand, Britain, and Ireland: the squeeze model fits best
These are the countries where the user’s proposed combination of immigration, constrained construction, and plentiful credit is most persuasive.
Canada
Canada’s housing demand has grown through household formation, urban job concentration, international migration, temporary residents, and investment demand. But the price effect becomes severe because housing construction, particularly in the most productive metropolitan areas, faces zoning restrictions, slow approvals, infrastructure constraints, and fragmented municipal control. The OECD has recommended zoning reform and faster permitting as central affordability measures. (OECD)
Immigration contributes to demand, especially when arrivals are concentrated in Toronto, Vancouver, and a few other cities. But blaming immigration alone mistakes the spark for the sealed furnace. A country that deliberately expands its population while allowing municipalities to block corresponding housing and infrastructure is manufacturing scarcity.
Australia
Australia has a similar pattern: strong metropolitan population growth, substantial immigration, expensive serviced land, slow planning, infrastructure lags, and tax settings that encourage property investment. The OECD identifies planning barriers and insufficient supply responsiveness as important contributors to Australia’s long-run price escalation. (OECD)
Cheap credit and investor-friendly tax treatment can then turn a shortage into an asset boom. Higher rates may reduce borrowing capacity, but they do not automatically make housing affordable because owners resist selling, builders face higher financing costs, and rents remain pressured by population growth.
New Zealand
New Zealand combines migration volatility with constrained urban land, planning limits, infrastructure financing problems, and weak competition in construction materials. OECD analysis has concluded that the planning system failed to accommodate population and migration growth adequately. (OECD)
New Zealand is also a useful counterexample to purely geographic explanations. It has abundant physical land, but not abundant legally buildable, serviced land near employment. Empty countryside does not substitute for permitted housing connected to roads, water, schools, and jobs.
United Kingdom
Britain’s central problem is chronic underbuilding in high-demand regions. The planning system gives local actors considerable ability to delay or block development, while green belts, height limits, infrastructure constraints, and case-by-case approvals restrict expansion. OECD analysis notes that supply has persistently lagged demand and that national building targets have repeatedly gone unmet. (OECD)
Immigration increases demand, but Britain would still have a severe housing problem because of household formation, regional job concentration, decades of low construction, and a tax system that discourages mobility. Immigration magnifies an existing structural shortage rather than creating it from empty air.
Ireland
Ireland adds another ingredient: extraordinarily strong employment growth concentrated in a small number of urban centers. Housing targets repeatedly underestimated the combined effects of job creation, smaller households, returning residents, and net immigration. Planning delays, infrastructure bottlenecks, construction costs, and the post-2008 collapse of building capacity limited the response. (OECD)
Ireland is a reminder that a previous construction crash can cripple supply for years. Even when prices signal the need for housing, skilled labor, finance, serviced sites, and viable builders do not reappear instantly.
4. The United States: there is no single national market
The US rate of roughly 65% conceals radically different local systems.
In parts of Texas and the Southeast, supply has historically responded relatively quickly through outward expansion and looser land-use rules. In coastal California, New York, Boston, and several high-productivity metros, zoning, environmental review, neighborhood opposition, lengthy approvals, and limited multifamily construction make supply much less elastic.
Consequently, immigration or job growth has very different effects depending on location:
- Where building is permitted, population growth produces more construction.
- Where building is blocked, population growth is capitalized into land prices and rents.
- Easy mortgage credit amplifies both outcomes but raises prices far more in constrained markets.
The national average therefore blurs the real relationship. The correct unit of analysis is often the metropolitan labor and housing market, not the country.
5. Spain, Portugal, Italy, Greece, Malta, and Cyprus: family ownership with localized shortages
Southern European ownership is supported by family transfers, inheritance, multigenerational living, weaker rental institutions, and a cultural preference for property. The result is relatively high ownership among established households, but poor access for younger adults.
Housing shortages are often sharply localized:
- Lisbon, Porto, Madrid, Barcelona, Milan, Rome, tourist regions, and islands face intense demand.
- Short-term rentals, second homes, tourism, foreign buyers, and migration can compete with local households.
- Slow permitting, heritage restrictions, limited infrastructure, and weak construction productivity constrain supply.
- Elsewhere, homes may sit empty in towns losing population.
Portugal’s affordability problem, for example, cannot be understood from its national stock alone. OECD recommendations emphasize permitting reform, denser construction, and better spatial planning. (OECD)
Spain also complicates the “just deregulate and build” argument. It built enormous quantities before 2008, but much of the construction was geographically mismatched, speculative, or dependent on unstable credit. Supply quantity matters, but so do location, infrastructure, financing quality, and actual household demand.
6. Germany, Switzerland, and Austria: low ownership by institutional design
Germany, Switzerland, and Austria appear near the bottom, but their low ownership rates are not simply evidence of housing-market failure.
They have historically offered stronger tenant protections, longer and more stable leases, professional landlords, and rental housing that middle-income households can treat as a durable home rather than a temporary holding cell. High transaction costs and less aggressive tax favoritism toward ownership also reduce the pressure to buy. (statranker.org)
Switzerland is the most striking case. It has very low outright ownership but substantial mortgage-financed ownership, partly because mortgage and tax structures discourage borrowers from fully paying off debt. Its headline rate therefore cannot be compared naively with Romania’s army of outright owners.
Low ownership can be a rational equilibrium when renting is secure. Conversely, forcing households to buy because renting is unstable is not necessarily a social triumph.
7. The Nordics and Netherlands: mortgage-heavy, regulated, and urban-constrained
Iceland and Norway have high ownership but much of it is mortgage-financed. Sweden, Denmark, Finland, and the Netherlands have lower headline rates, substantial rental or cooperative sectors, and often very high household mortgage exposure.
These markets can experience severe price pressure because:
- Credit is widely available.
- Mortgage tax advantages have historically encouraged leverage.
- Employment is concentrated in a few prosperous cities.
- Urban planning and construction response can be slow.
- Rent regulation can protect incumbent tenants while making entry difficult for outsiders.
The result is often a two-track system: protected incumbents and owners accumulate benefits, while young adults, newcomers, and mobile workers face high entry costs.
8. Latin America: ownership does not always mean formal, financeable wealth
Costa Rica, Mexico, Chile, and Colombia must be interpreted carefully. Ownership may include self-built homes, inherited property, informal settlements, incomplete title, or housing lacking infrastructure and access to formal credit.
A high ownership rate can therefore coexist with:
- Weak legal title
- Overcrowding
- Long commutes
- Poor infrastructure
- Limited mortgage access
- Large informal rental sectors
Colombia’s low reported rate does not necessarily mean that it has adopted a German-style professional rental model. It reflects a very different combination of income distribution, informality, urbanization, credit access, and land tenure.
How important is each proposed cause?
| Factor | What it does | Where it matters most | Main qualification |
|---|---|---|---|
| Immigration | Adds households and concentrates demand in gateway cities | Canada, Australia, New Zealand, UK, Ireland, parts of the US and Europe | Usually an amplifier, not the sole or dominant long-run cause |
| Restrictive zoning and planning | Prevents construction from responding to demand | High-productivity cities and tightly governed metros | Safety codes matter less than density limits, delays, appeals, and infrastructure bottlenecks |
| Easy credit | Expands bidding power and raises asset values | Mortgage-heavy Anglo, Nordic, Dutch, and Iberian markets | Most inflationary when supply is constrained |
| Buyer subsidies | Raises effective purchasing power | Countries using grants, tax deductions, guarantees, subsidized mortgages | Often capitalized into prices |
| Privatization | Creates high measured ownership quickly | Eastern Europe and China | Historical transfer, not evidence of current affordability |
| Rental institutions | Make ownership less necessary | Germany, Switzerland, Austria, parts of the Netherlands and Nordics | Low ownership may reflect secure renting rather than deprivation |
| Aging and inheritance | Raises outright ownership and reduces turnover | Eastern and Southern Europe, Japan | Can lock younger households out despite high national ownership |
| Tourism and foreign demand | Concentrates demand in particular cities and coastal areas | Portugal, Spain, Greece, Malta, Cyprus | Usually local rather than a complete national explanation |
What governments frequently get wrong
The most common policy failure is to stimulate demand while rationing supply.
A government restricts density, delays permits, underfunds infrastructure, and allows local vetoes. It then announces grants, tax credits, mortgage guarantees, or subsidized interest rates to “help” buyers. More money chases nearly the same number of homes, sellers capture much of the subsidy, and the next group of buyers faces a still-higher price. The policy is a ladder whose lower rungs disappear as people climb it.
A more coherent program would combine:
- By-right housing at greater density near employment, transit, and existing infrastructure.
- Firm approval deadlines and narrower grounds for discretionary rejection.
- Infrastructure financing tied to population growth, including water, transport, schools, and utilities.
- Less tax favoritism toward leveraged property investment and fewer demand-only buyer subsidies.
- Prudential credit limits, especially debt-to-income and loan-to-value rules during booms.
- A larger professional and social rental sector, so ownership is not the only route to housing security.
- Migration planning connected to construction capacity, rather than setting population policy and housing policy in separate bureaucratic universes.
Bottom line
The Visual Capitalist ranking is interesting, but it is easy to read backward.
- Eastern Europe and China rank highly mainly because governments transferred existing housing to occupants.
- Canada, Australia, New Zealand, Britain, and Ireland best match the combined immigration, restricted-supply, and easy-credit explanation.
- Germany, Switzerland, and Austria demonstrate that low ownership can coexist with functional, secure rental institutions.
- Southern Europe shows that high ownership among older households can coexist with severe exclusion of younger buyers.
- Credit does not create land, labor, or infrastructure. When supply is rigid, it mostly creates larger bids.
- Immigration raises demand, but the magnitude of the price effect depends heavily on whether a country permits housing construction where newcomers and jobs are actually located.
The real divide is not between high-ownership and low-ownership countries. It is between systems that allow housing supply to respond to economic and demographic change, and systems that funnel every new household and every new dollar of credit into an increasingly vicious auction for the existing stock.
Same ownership label, very different housing systems
Outright and mortgage-financed ownership among selected countries, as a share of households.
| country | outright | mortgage |
|---|---|---|
| Romania | 91.7 | 1.1 |
| Croatia | 84.3 | 6.1 |
| Bulgaria | 84 | 1.2 |
| Lithuania | 74.6 | 12.3 |
| Poland | 74.1 | 10.7 |
| Slovakia | 70.3 | 23.2 |
| Chile | 44.3 | 12.8 |
| Austria | 31.4 | 16.5 |
| Germany | 24.3 | 16.7 |
| Denmark | 13.7 | 38.5 |
| Switzerland | 4.7 | 33.5 |
| Colombia | 31.1 | 4.9 |