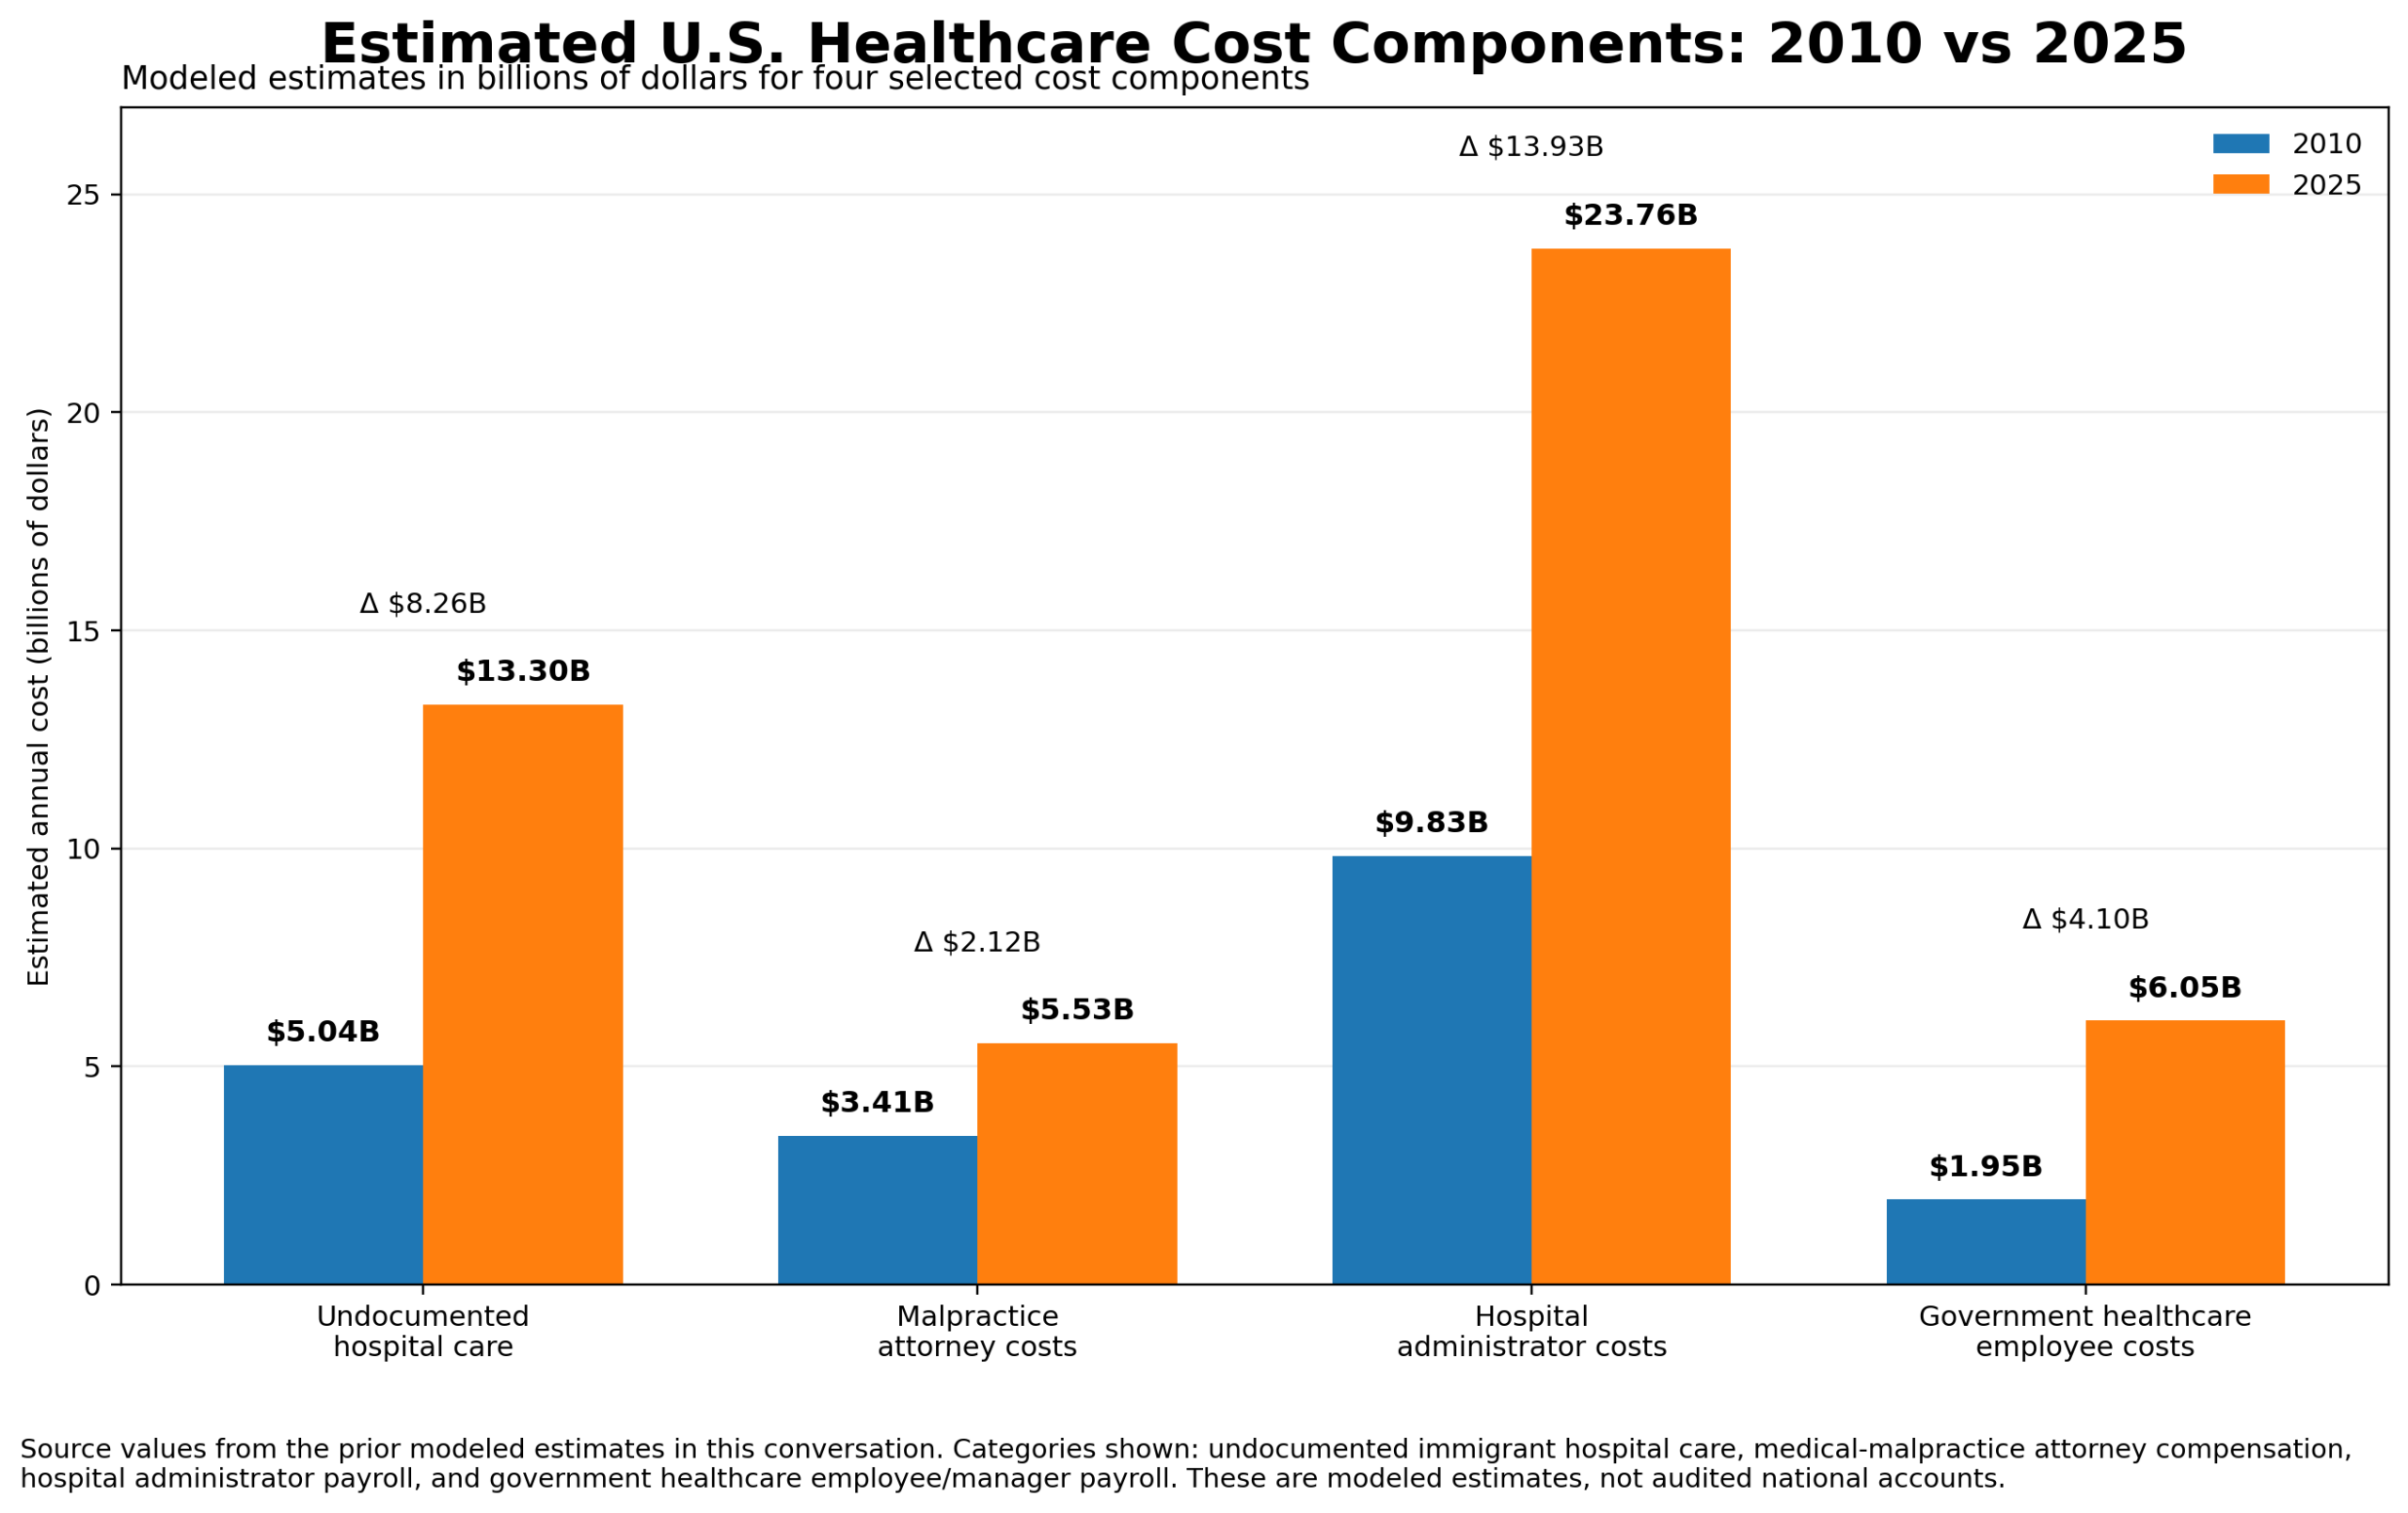
Between 2010 and 2025, U.S. healthcare spending more than doubled, but the costs most often blamed in political arguments did not grow at the same pace. Using consistent population, employment, salary, and utilization assumptions, this analysis estimates how spending on undocumented immigrants’ hospital care, medical-malpractice attorneys, government healthcare managers, and hospital administrators changed over the period. The largest increase was not litigation or uncompensated immigrant care, but the expanding administrative workforce inside hospitals and government, whose combined estimated payroll rose from $11.8 billion to nearly $30 billion.
1. Hospital care for undocumented immigrants
Hospitals do not publish a complete national database identifying the immigration status of every patient. The cost must therefore be estimated.
The model begins with:
- 11.2 million undocumented immigrants in 2010
- 14.8 million in 2025
- A constant 9% annual hospital-use rate
- An estimated average annual hospital cost of $5,000 per user in 2010
- A 2025 cost per user adjusted according to the growth in hospital spending per U.S. resident
Pew Research Center estimated that 11.2 million unauthorized immigrants lived in the United States in 2010. The 14.8 million figure is a preliminary May 2025 estimate. Pew separately concluded that the population remained above its 2023 level of 14 million during mid-2025, although it did not yet have enough complete data to produce an equally precise official 2025 estimate.
The fixed 9% use rate comes from a UCLA analysis finding that 9% of uninsured undocumented adults in California had visited an emergency room during the previous year. The same rate is deliberately used in both years so population growth and medical-cost growth, rather than a changing utilization assumption, drive the result.
Table 2: Undocumented immigrant hospital-care estimate
| Measure | 2010 | 2025 | Change |
|---|---|---|---|
| Undocumented population | 11.2 million | 14.8 million | +32% |
| Assumed annual hospital-use rate | 9% | 9% | No change |
| Estimated hospital users | 1.008 million | 1.332 million | +32% |
| Average annual hospital cost per user | $5,000 | $9,986 | +100% |
| Estimated hospital cost | $5.04 billion | $13.30 billion | +164% |
| Share of total hospital spending | 0.62% | 0.74% | +0.12 percentage point |
| Share of all healthcare spending | 0.194% | 0.233% | +0.039 percentage point |
The undocumented population grew approximately 32%, but the modeled hospital cost increased 164%. The difference comes from the rapidly rising cost of hospital care.
Hospital spending per U.S. resident roughly doubled between 2010 and 2025. The model therefore increases the average annual cost per hospital user from $5,000 to approximately $9,986.
Under these assumptions, undocumented immigrant hospital care increased from approximately:
$5.0 billion in 2010 to $13.3 billion in 2025
Its share of total hospital spending increased from 0.62% to 0.74%.
Its share of the entire healthcare economy increased from 0.194% to 0.233%.
That is a meaningful cost, particularly for hospitals and states with large undocumented populations. Nationally, however, the model places it at less than one-quarter of 1% of total healthcare spending.
What this model includes
The estimate treats the modeled hospital expense as the gross cost of care.
It does not subtract:
- Patient payments
- Emergency Medicaid reimbursements
- State-funded immigrant coverage
- County assistance
- Hospital charity funding
- Private insurance held by some undocumented residents
It also does not include nonhospital physician visits, outpatient drugs, community clinics, or state healthcare programs that provide broader coverage regardless of immigration status.
2. Medical-malpractice attorney compensation
The broad phrase “litigation costs” can include almost anything related to medical liability:
- Attorneys
- Court expenses
- Settlements
- Jury awards
- Malpractice-insurance premiums
- Expert witnesses
- Administrative costs
- Defensive testing
- Defensive hospitalization
- Procedures ordered partly to reduce legal exposure
That creates a measurement swamp. This model measures a narrower item that can be estimated consistently:
The compensation earned by attorneys who practice medical-malpractice law
Lawyers.com currently lists 51,956 medical-malpractice lawyers. That equals approximately 3.77% of the roughly 1.37 million active lawyers reported by the American Bar Association for 2025. The model applies that same 3.77% specialty share to the 1,203,097 active lawyers counted in 2010.
Salary.com reports a 2025 median medical-malpractice attorney salary of $106,449. Because a directly comparable specialty salary is not available for 2010, the model works backward using the national change in lawyer compensation, producing a 2010 specialty estimate of approximately $75,180.
Table 3: Medical-malpractice attorney compensation
| Measure | 2010 | 2025 | Change |
|---|---|---|---|
| Active U.S. lawyers | 1,203,097 | About 1.37 million | About +14% |
| Assumed medical-malpractice share | 3.77% | 3.77% | No change |
| Estimated medical-malpractice attorneys | 45,375 | 51,956 | +14.5% |
| Estimated median income | $75,180 | $106,449 | +41.6% |
| Estimated attorney compensation | $3.41 billion | $5.53 billion | +62% |
| Share of total healthcare spending | 0.131% | 0.097% | −0.034 percentage point |
Attorney compensation increased by approximately $2.1 billion, but the healthcare system grew much faster. As a result, estimated medical-malpractice attorney compensation fell from: 0.131% of national healthcare spending in 2010 to 0.097% in 2025
That doesn’t mean medical liability became cheaper in every sense. It means the estimated payroll of medical-malpractice attorneys became smaller relative to the healthcare economy.
What this model does not include
The attorney-compensation estimate excludes:
- Settlements and judgments
- Malpractice-insurance premiums
- Law-firm support staff
- Expert-witness expenses
- Court operations
- Insurer legal departments
- Hospital legal departments
- Defensive medicine
- Additional tests and procedures
- Law-firm profits above reported attorney compensation
It also probably overcounts some attorneys because online directories allow a lawyer to list several practice areas. A lawyer counted under medical malpractice may spend only part of the year handling those cases. On the other hand, salary data may understate the income of successful law-firm partners and contingency-fee attorneys. The estimate should therefore be read as a measure of medical-malpractice attorney compensation, not the full economic cost of medical litigation.
3. Government healthcare-management payroll
Government healthcare administration is another category that often grows or shrinks depending on how it’s defined. A full administrative-cost calculation would include:
- Medicare and Medicaid claims systems
- Eligibility workers
- Public-health departments
- Regulators
- Auditors
- Fraud investigators
- Lawyers
- Data analysts
- Customer-service workers
- Information-technology staff
- Buildings
- Software contracts
- Outside claims processors
- Consulting firms
- Employee benefits and pensions
The model used here is narrower. It estimates the salary cost of government-employed workers classified as: Medical and Health Services Managers BLS defines these employees as workers who plan, direct, or coordinate medical and health services. BLS counted 282,990 Medical and Health Services Managers nationally in 2010, with a median hourly wage of $40.52. The May 2025 figures report 597,080 managers and a median annual wage of $123,860.
To estimate how many worked for government in each year, the model uses the government share recorded in the 2023 BLS industry data:
- 20,360 federal managers
- 7,910 state managers
- 9,560 local managers
That was 37,830 government managers out of 515,100 nationally, or approximately 7.34%. The same government share and federal-state-local distribution are applied to both 2010 and 2025. Government salary relationships are also preserved. Federal managers earned more than the national occupation median, while state and local managers earned somewhat less.
Table 4: Government healthcare-management payroll
| Government level | 2010 employees | 2025 employees | 2010 median salary | 2025 median salary | 2010 payroll | 2025 payroll |
|---|---|---|---|---|---|---|
| Federal | 11,186 | 23,600 | $108,038 | $158,772 | $1.21B | $3.75B |
| State | 4,346 | 9,169 | $74,491 | $109,471 | $324M | $1.00B |
| Local | 5,252 | 11,082 | $80,034 | $117,618 | $420M | $1.30B |
| Combined | 20,783 | 43,851 | — | — | $1.95B | $6.05B |
The estimated government healthcare-management workforce increased approximately 111%, from about 20,800 workers to 43,900. Median salaries increased about 47%. Because the number of managers and their compensation both increased, modeled payroll rose approximately 210%: $1.95 billion in 2010 to $6.05 billion in 2025 As a share of national healthcare spending, government healthcare-manager compensation rose from: 0.075% to 0.106% That is an increase of 0.031 percentage point.
The modeled payroll grew much faster than national healthcare spending, although it still represented only about one-tenth of 1% of total spending in 2025.
What this model does not include
This is not the complete government healthcare-administration budget. It excludes most:
- Clerical workers
- Claims processors
- Eligibility employees
- Public-health nurses
- Inspectors
- Auditors
- Economists
- Statisticians
- Lawyers
- Investigators
- IT employees
- Outside contractors
- Employee benefits
- Pension costs
- Office and building costs
- State exchange systems
- Medicare contractors
- Medicaid managed-care administration
It measures one identifiable occupation that represents senior healthcare administration and management.
The 2010-to-2025 deltas
The common denominator reveals the direction of change clearly.
| Modeled cost | 2010 share of healthcare spending | 2025 share | Percentage-point change |
|---|---|---|---|
| Undocumented immigrant hospital care | 0.194% | 0.233% | +0.039 |
| Government healthcare-manager compensation | 0.075% | 0.106% | +0.031 |
| Medical-malpractice attorney compensation | 0.131% | 0.097% | −0.034 |
| Combined | 0.400% | 0.436% | +0.036 |
The individual changes nearly cancel one another. Hospital costs attributed to undocumented immigrants increased by 0.039 percentage point. Government healthcare-management payroll increased by 0.031 percentage point. Malpractice-attorney compensation declined by 0.034 percentage point. The combined increase was only 0.036 percentage point.
4. Hospital administration grew alongside government healthcare administration
Hospitals need managers to run clinical departments, supervise staff, maintain patient records, manage billing, monitor budgets, comply with regulations, and coordinate increasingly complicated medical systems. BLS classifies these workers as Medical and Health Services Managers, the same occupation used in the government-administration estimate. This gives us an apples-to-apples comparison between administrators working inside hospitals and administrators working for federal, state, and local government.
This is a narrow estimate of management payroll. It does not include hospital billing clerks, coders, receptionists, lawyers, accountants, information-technology workers, human-resources staff, consultants, or insurance-processing contractors.
Estimating hospital administrators in 2010
BLS counted 282,990 Medical and Health Services Managers nationwide in 2010, with a median wage of $40.52 per hour, equivalent to about $84,282 per year. (Bureau of Labor Statistics)
The closest BLS industry breakdown to that year reported that 38% of medical and health services managers worked in hospitals in 2008. It also reported a hospital median salary of $87,040, compared with an $80,240 median for the occupation overall. Hospital managers therefore earned about 8.5% more than the occupation-wide median. (FRASER)
Estimating hospital administrators in 2025
BLS counted 597,080 Medical and Health Services Managers in May 2025, with a median hourly wage of $59.55, equivalent to approximately $123,864 annually. (Bureau of Labor Statistics)
The latest BLS industry distribution reports that hospitals employ 29% of these managers. Hospital managers earned a median of $130,690 in 2024, compared with $117,960 for the occupation overall, a hospital wage premium of about 10.8%. (Bureau of Labor Statistics)
Hospital administration estimate
| Measure | 2010 | 2025 | Change |
|---|---|---|---|
| Medical and health services managers nationwide | 282,990 | 597,080 | +111% |
| Estimated share employed by hospitals | 38% | 29% | −9 percentage points |
| Estimated hospital managers | 107,536 | 173,153 | +61% |
| Estimated median hospital-manager salary | $91,424 | $137,231 | +50% |
| Estimated hospital-management payroll | $9.83B | $23.76B | +142% |
| Share of national healthcare spending | 0.378% | 0.417% | +0.039 percentage point |
The percentage of healthcare managers working in hospitals declined, partly because management employment expanded faster in outpatient centers, physician practices, government programs, nursing facilities, and other healthcare settings. But the overall occupation grew so rapidly that hospitals still added an estimated 65,600 management positions. Hospital-management payroll increased by about $13.9 billion, from $9.8 billion to $23.8 billion. Its share of national healthcare spending increased modestly, from approximately 0.38% to 0.42%. That is about 42 cents out of every $100 spent on healthcare in 2025.
Comparing hospital and government healthcare administration
The earlier government estimate found that federal, state, and local governments employed approximately 20,783 healthcare managers in 2010 and 43,851 in 2025. Their estimated payroll increased from $1.95 billion to $6.05 billion.
Placed beside the hospital figures, both administrative systems expanded, but government healthcare management grew faster.
| Measure | Hospital administration | Government healthcare administration |
|---|---|---|
| 2010 estimated managers | 107,536 | 20,783 |
| 2025 estimated managers | 173,153 | 43,851 |
| Headcount growth | +61% | +111% |
| 2010 estimated payroll | $9.83B | $1.95B |
| 2025 estimated payroll | $23.76B | $6.05B |
| Payroll growth | +142% | +210% |
| 2010 share of healthcare spending | 0.378% | 0.075% |
| 2025 share of healthcare spending | 0.417% | 0.106% |
| Change in spending share | +0.039 pp | +0.031 pp |
Government healthcare managers equaled about 19% of the hospital-management workforce in 2010. By 2025, they equaled approximately 25%. The same change appears in payroll. Government healthcare-management compensation was about 20% as large as hospital-management payroll in 2010 and approximately 25% as large in 2025. Combined hospital and government healthcare-management payroll increased from approximately: $11.78 billion in 2010 to $29.81 billion in 2025. Its combined share of national healthcare spending increased from: 0.453% to 0.523% That is an increase of approximately $18 billion annually and 0.070 percentage point of total healthcare spending.
Is there a correlation?
There is a clear directional relationship: hospital administration and government healthcare administration both grew substantially between 2010 and 2025. However, two observations are not enough to calculate a meaningful statistical correlation. With only a starting point and an ending point, a Pearson correlation would automatically be positive when both series rise. It would be mathematical confetti rather than evidence. What the comparison does show is that:
- Hospital administrative headcount increased 61%.
- Government healthcare administrative headcount increased 111%.
- Hospital management payroll increased 142%.
- Government management payroll increased 210%.
- Both increased slightly as shares of total healthcare spending.
BLS identifies several forces increasing demand for healthcare managers: an aging population, technological change, shifting policies and regulations, evolving care models, electronic records, billing systems, and the growing complexity of healthcare delivery. Managers are responsible for compliance, budgets, billing, staffing, records, and coordination with insurers and government programs. (Bureau of Labor Statistics) That creates a plausible feedback loop:
- Government programs and regulations become more complicated.
- Government hires managers to administer and enforce them.
- Hospitals hire managers to interpret the rules, document compliance, obtain reimbursement, contest denials, and report results.
- New systems produce additional reporting, oversight, auditing, and management requirements.
- Both sides hire more administrators to interact with the other side.
The evidence does not prove that government administrative growth caused hospital administrative growth. Hospitals were also becoming larger, more technologically complex, and more consolidated. Patient volumes, electronic records, quality measurement, insurance negotiations, staffing, and clinical specialization all increased management demand. But the two systems appear to be growing together, with government administration expanding faster than hospital administration. The public rulebook and the hospital compliance apparatus are becoming larger parts of the same administrative ecosystem.
Updated modeled cost comparison
Adding hospital-management payroll to the three earlier estimates produces:
| Modeled direct cost | 2010 | 2025 | Increase |
|---|---|---|---|
| Undocumented immigrant hospital care | $5.04B | $13.30B | +$8.26B |
| Medical-malpractice attorney compensation | $3.41B | $5.53B | +$2.12B |
| Government healthcare-manager compensation | $1.95B | $6.05B | +$4.10B |
| Hospital healthcare-manager compensation | $9.83B | $23.76B | +$13.93B |
| Combined modeled costs | $20.23B | $48.64B | +$28.41B |
Hospital administration is the largest of these four modeled direct costs. Its estimated 2025 payroll is:
- About 1.8 times the modeled undocumented immigrant hospital cost
- About 3.9 times government healthcare-manager payroll
- About 4.3 times medical-malpractice attorney compensation
The administrative workforce is not the largest reason American healthcare is expensive, but it is a measurable part of the machinery. Hospitals and government together employed an estimated 217,000 healthcare managers in 2025, with combined compensation approaching $30 billion annually, before benefits, contractors, support staff, buildings, software, and information systems are counted.