How delistings, failed contracts, shifting sales mixes, and investors who can’t do math can make a weak housing market look stronger than it is
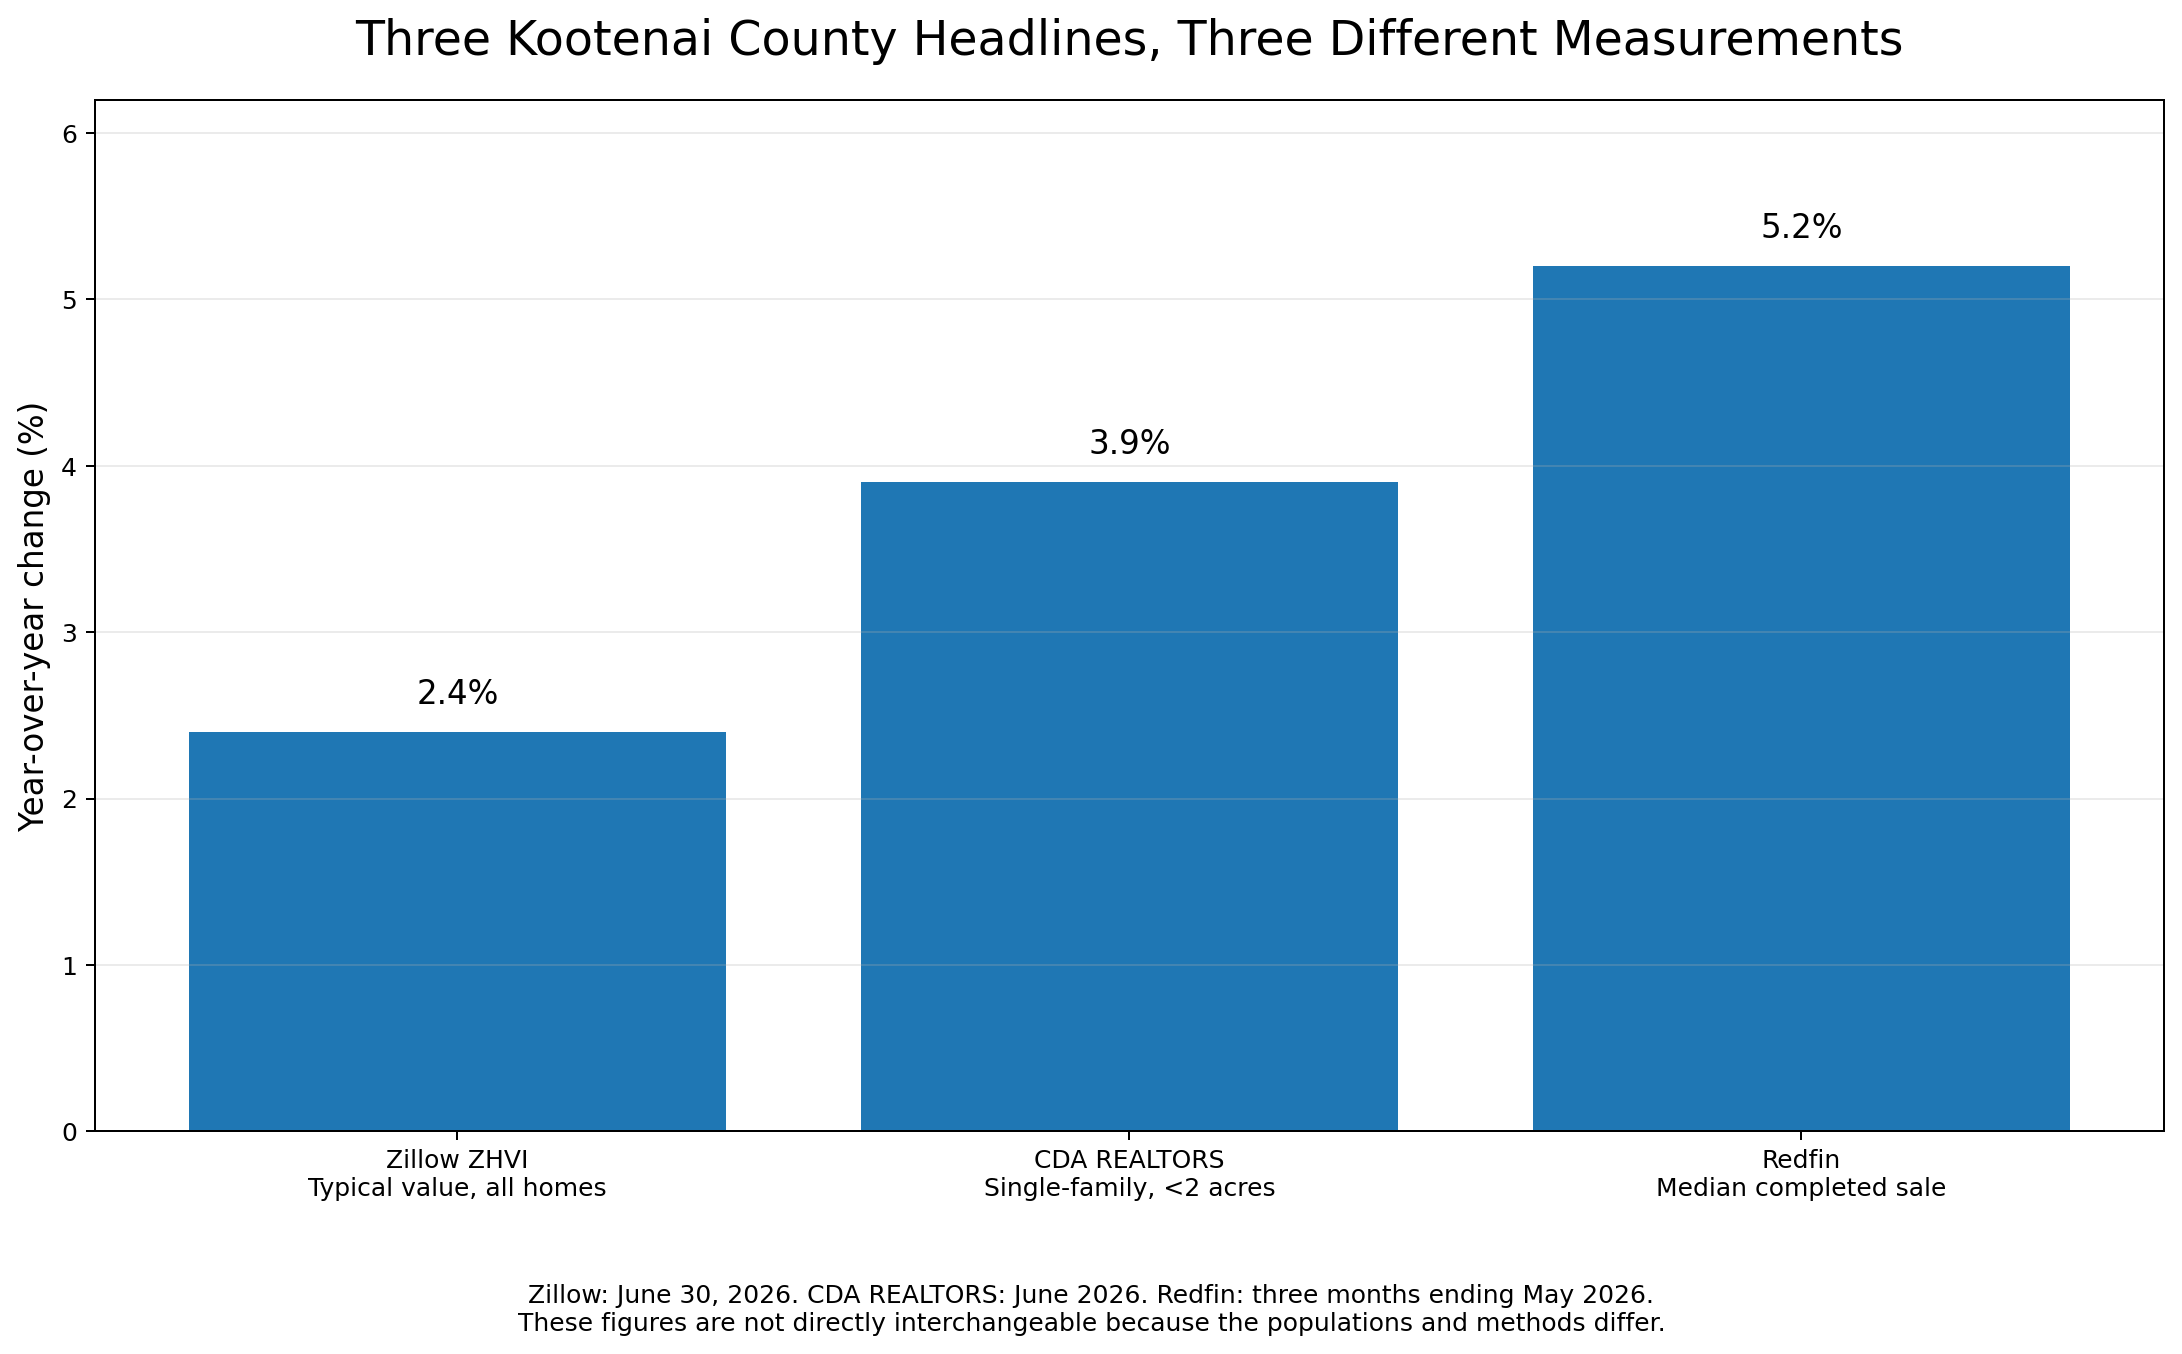
According to Zillow, Kootenai County home values were up 2.4% over the year ending June 2026. Redfin says prices were up 5.2% over the three months ending in May. The Coeur d’Alene Regional REALTORS reported that the June median price was up 3.9%. All three numbers can be correct. They can also give a misleading impression of what’s happening to someone trying to sell an ordinary house.
None of the headline figures fully captures the growing collection of overpriced listings, withdrawn properties, failed contracts, rapid relistings, and speculative purchases that only make financial sense if the owner assumes the market will rescue them.
Three Headlines From Three Different Markets
Zillow reports that Kootenai County’s average home value was $608,647 at the end of June, up 2.4% over the prior year. Zillow’s number comes from its Home Value Index, which estimates the value of a typical property using the broader distribution of homes, not just houses that sold. (Zillow)
Redfin reports a median completed sale price of $573,281, up 5.2% over the three months ending May. That number is based on homes that reached closing. It doesn’t include properties that were withdrawn, listings that expired, or purchase agreements that fell apart. (Redfin)
The Coeur d’Alene Regional REALTORS reported a June median of $565,000, up 3.9% from June 2025. Its snapshot covers site-built single-family homes on less than two acres, making it a narrower slice than Zillow’s countywide index and excluding many rural acreage properties. (Coeur d’Alene Regional REALTORS® | CRR)
| Report | What it measures | What it can miss |
|---|---|---|
| Zillow ZHVI | Estimated value of the typical home | Immediate transaction pressure on individual sellers |
| Redfin median sale price | Midpoint of completed sales | Failed deals, withdrawals, expired listings and properties that never sell |
| Local REALTORS median | Completed sales within a defined property category | Acreage, manufactured homes and other excluded property types |
Closed sales aren’t a random sample of every house someone tried to sell. They’re the properties that found a buyer, survived inspection, passed appraisal, obtained insurance, secured financing and reached closing.
How Prices Can Rise While Sellers Are Cutting Prices
Suppose 100 owners list houses. Twenty price them reasonably and sell. Another group owns desirable waterfront, luxury or newer properties and also closes. The remainder starts too high, sits for months, reduces the price, withdraws, relists, changes agents, tries renting, or simply gives up. The median completed sale price can rise because the successful transactions contain a larger share of expensive homes. Meanwhile, the ordinary homeowner with the stale listing is discovering that buyers won’t pay the advertised price.
That’s a composition effect. The mix of homes sold changes, so the median changes even if the value of a particular ordinary property is flat or falling. Kootenai County is especially vulnerable to this problem because it contains very different markets. A suburban house in Post Falls, a lakefront estate in Harrison, a new house in Hayden and a 15-acre property outside Athol shouldn’t be treated as interchangeable units. A relatively small number of expensive closings can pull the county median upward while a separate part of the market weakens. Redfin’s current page offers examples of recently completed sales with last asking prices ranging from $345,000 to nearly $5.9 million. That’s a wide mix for one county statistic to digest. (Redfin)
Pending Doesn’t Mean Sold
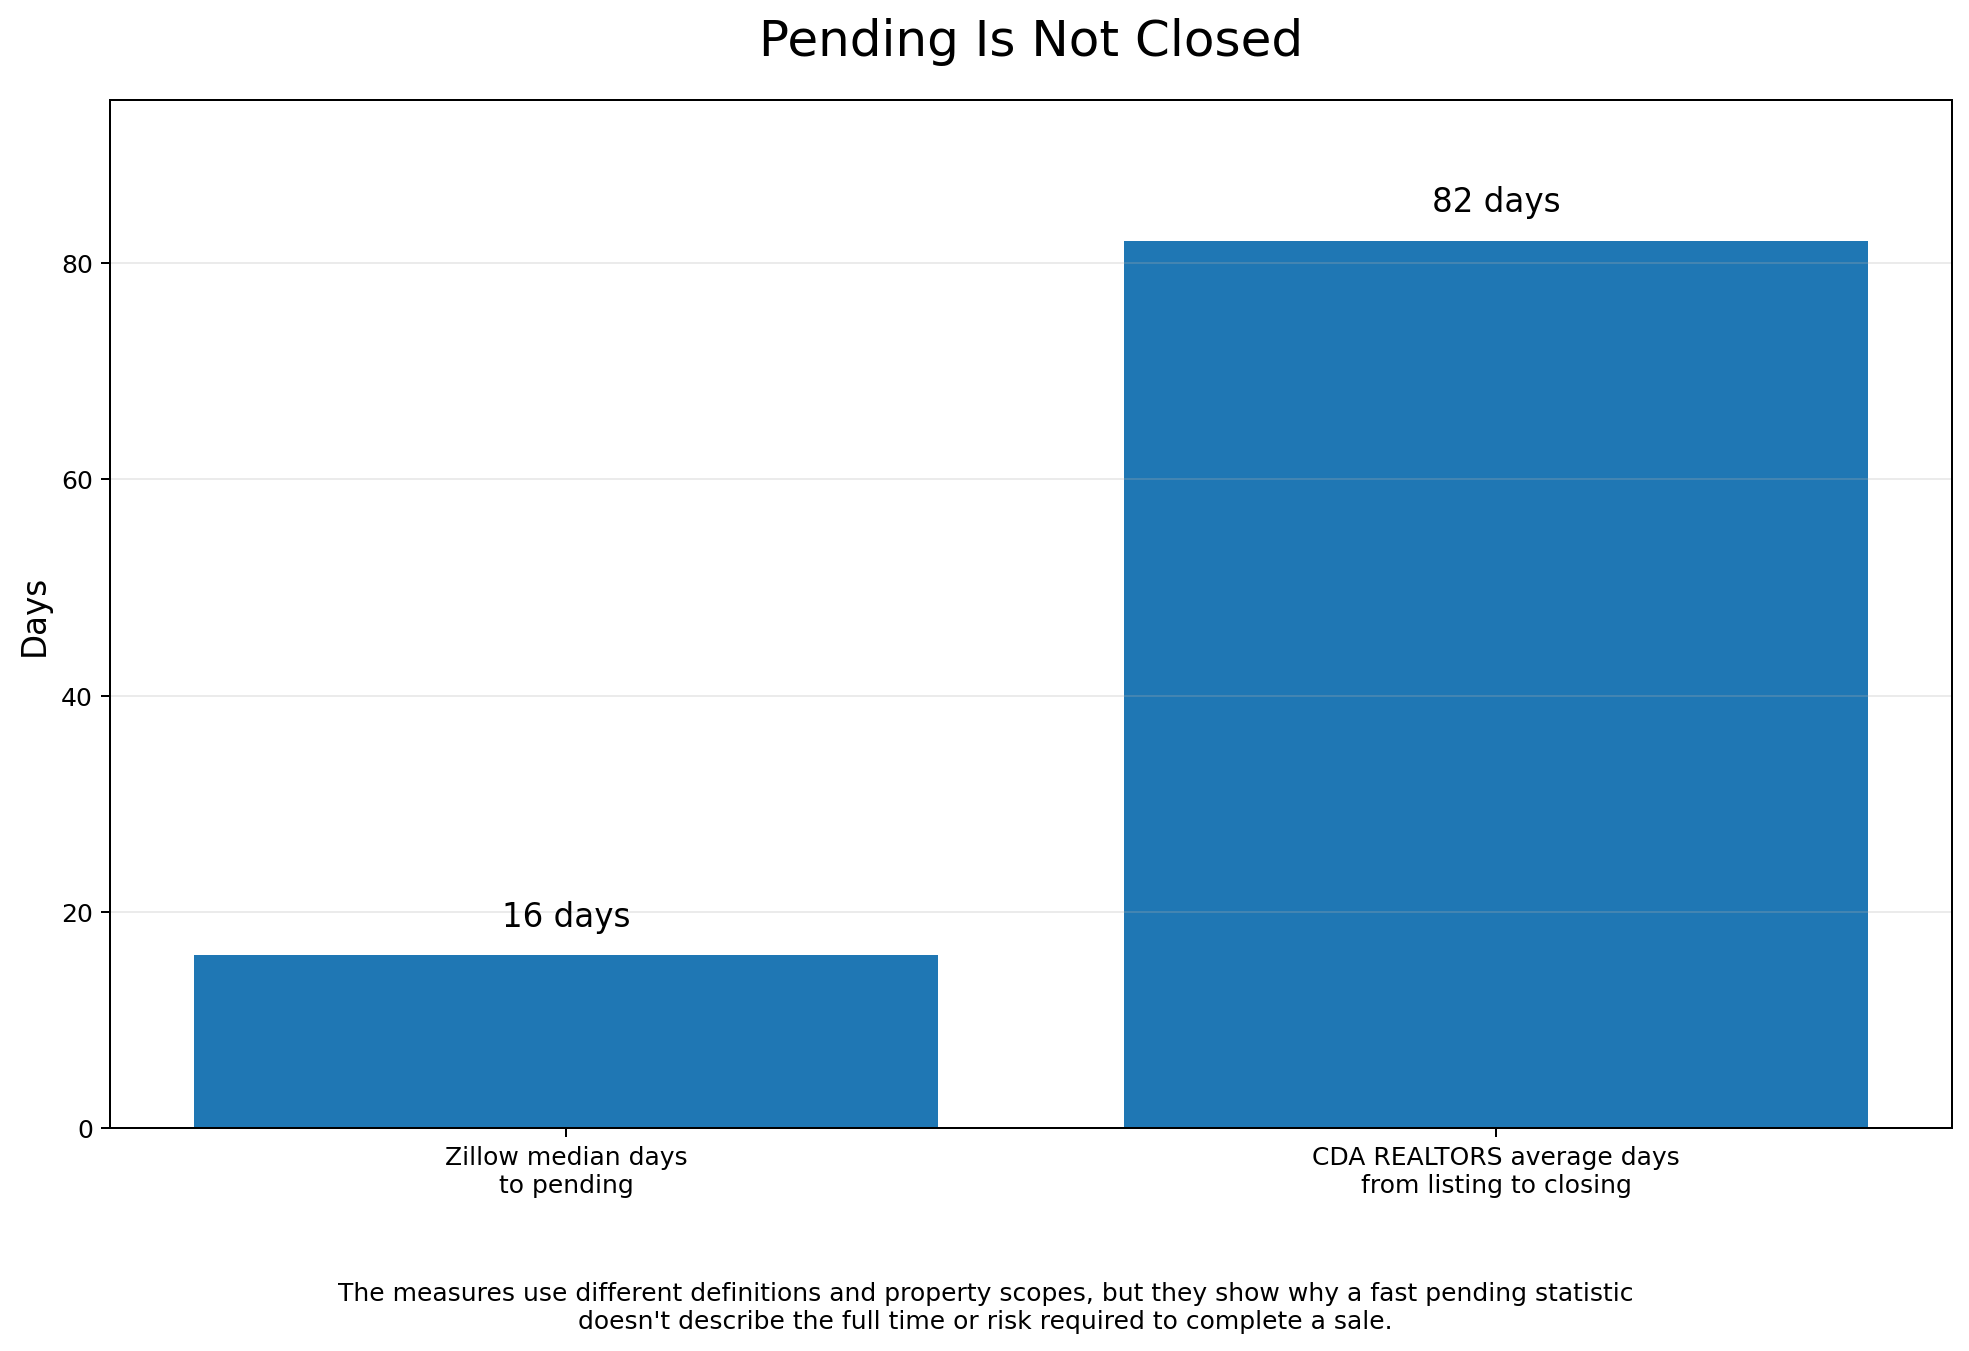
Zillow reports that Kootenai County homes go pending in about 16 days. That sounds like a fast market, but pending only means that the seller accepted an offer. It doesn’t mean the transaction closed. (Zillow) The local REALTORS report says the average period between listing and completed closing was 82 days in June. The two figures use different property populations and statistical definitions, so they shouldn’t be treated as a perfect comparison. They still illustrate why “days to pending” isn’t the same as the time needed to sell a house and receive the money. (Coeur d’Alene Press)
Zillow has acknowledged another weakness in the days-to-pending statistic: it excludes active homes that haven’t gone under contract and those that may never go pending. The houses that sell quickly enter the calculation. A pending agreement can also fail. Redfin counted slightly more than 47,000 canceled U.S. home-purchase agreements in April 2026. That was 13.4% of the homes that went under contract during the measured period. In round numbers, about one out of every seven contracts failed. (Redfin)
Redfin defines a cancellation as a property moving from pending or contingent back to active after the seller had accepted an offer. Common failure points include financing, appraisal, inspection, insurance, the buyer’s existing house failing to sell, or one party simply deciding the deal has acquired too many teeth. (Redfin)
There isn’t a reliable public cancellation rate specifically for Kootenai County, so the national 13.4% shouldn’t be presented as a local figure. It does show why pending volume and pending speed can’t be treated as completed demand.
The Delist-and-Relist Shuffle
The pattern of houses disappearing and returning at lower prices isn’t your imagination. Redfin found that 5.8% of active U.S. listings were delisted in April 2026, tied for the highest share since the beginning of the pandemic. It also found that 2.5% of active listings were properties that had previously been taken off the market and then relisted, the highest proportion since 2020. Redfin attributed much of the behavior to sellers who couldn’t obtain their desired price. (Redfin)
The published number understates rapid relisting. Redfin doesn’t count a removal as a delisting when the property returns within 31 days. A seller can pull a listing, change agents, obtain a new MLS entry, revise the price and return two weeks later without appearing in Redfin’s formal delisting series. (Redfin)
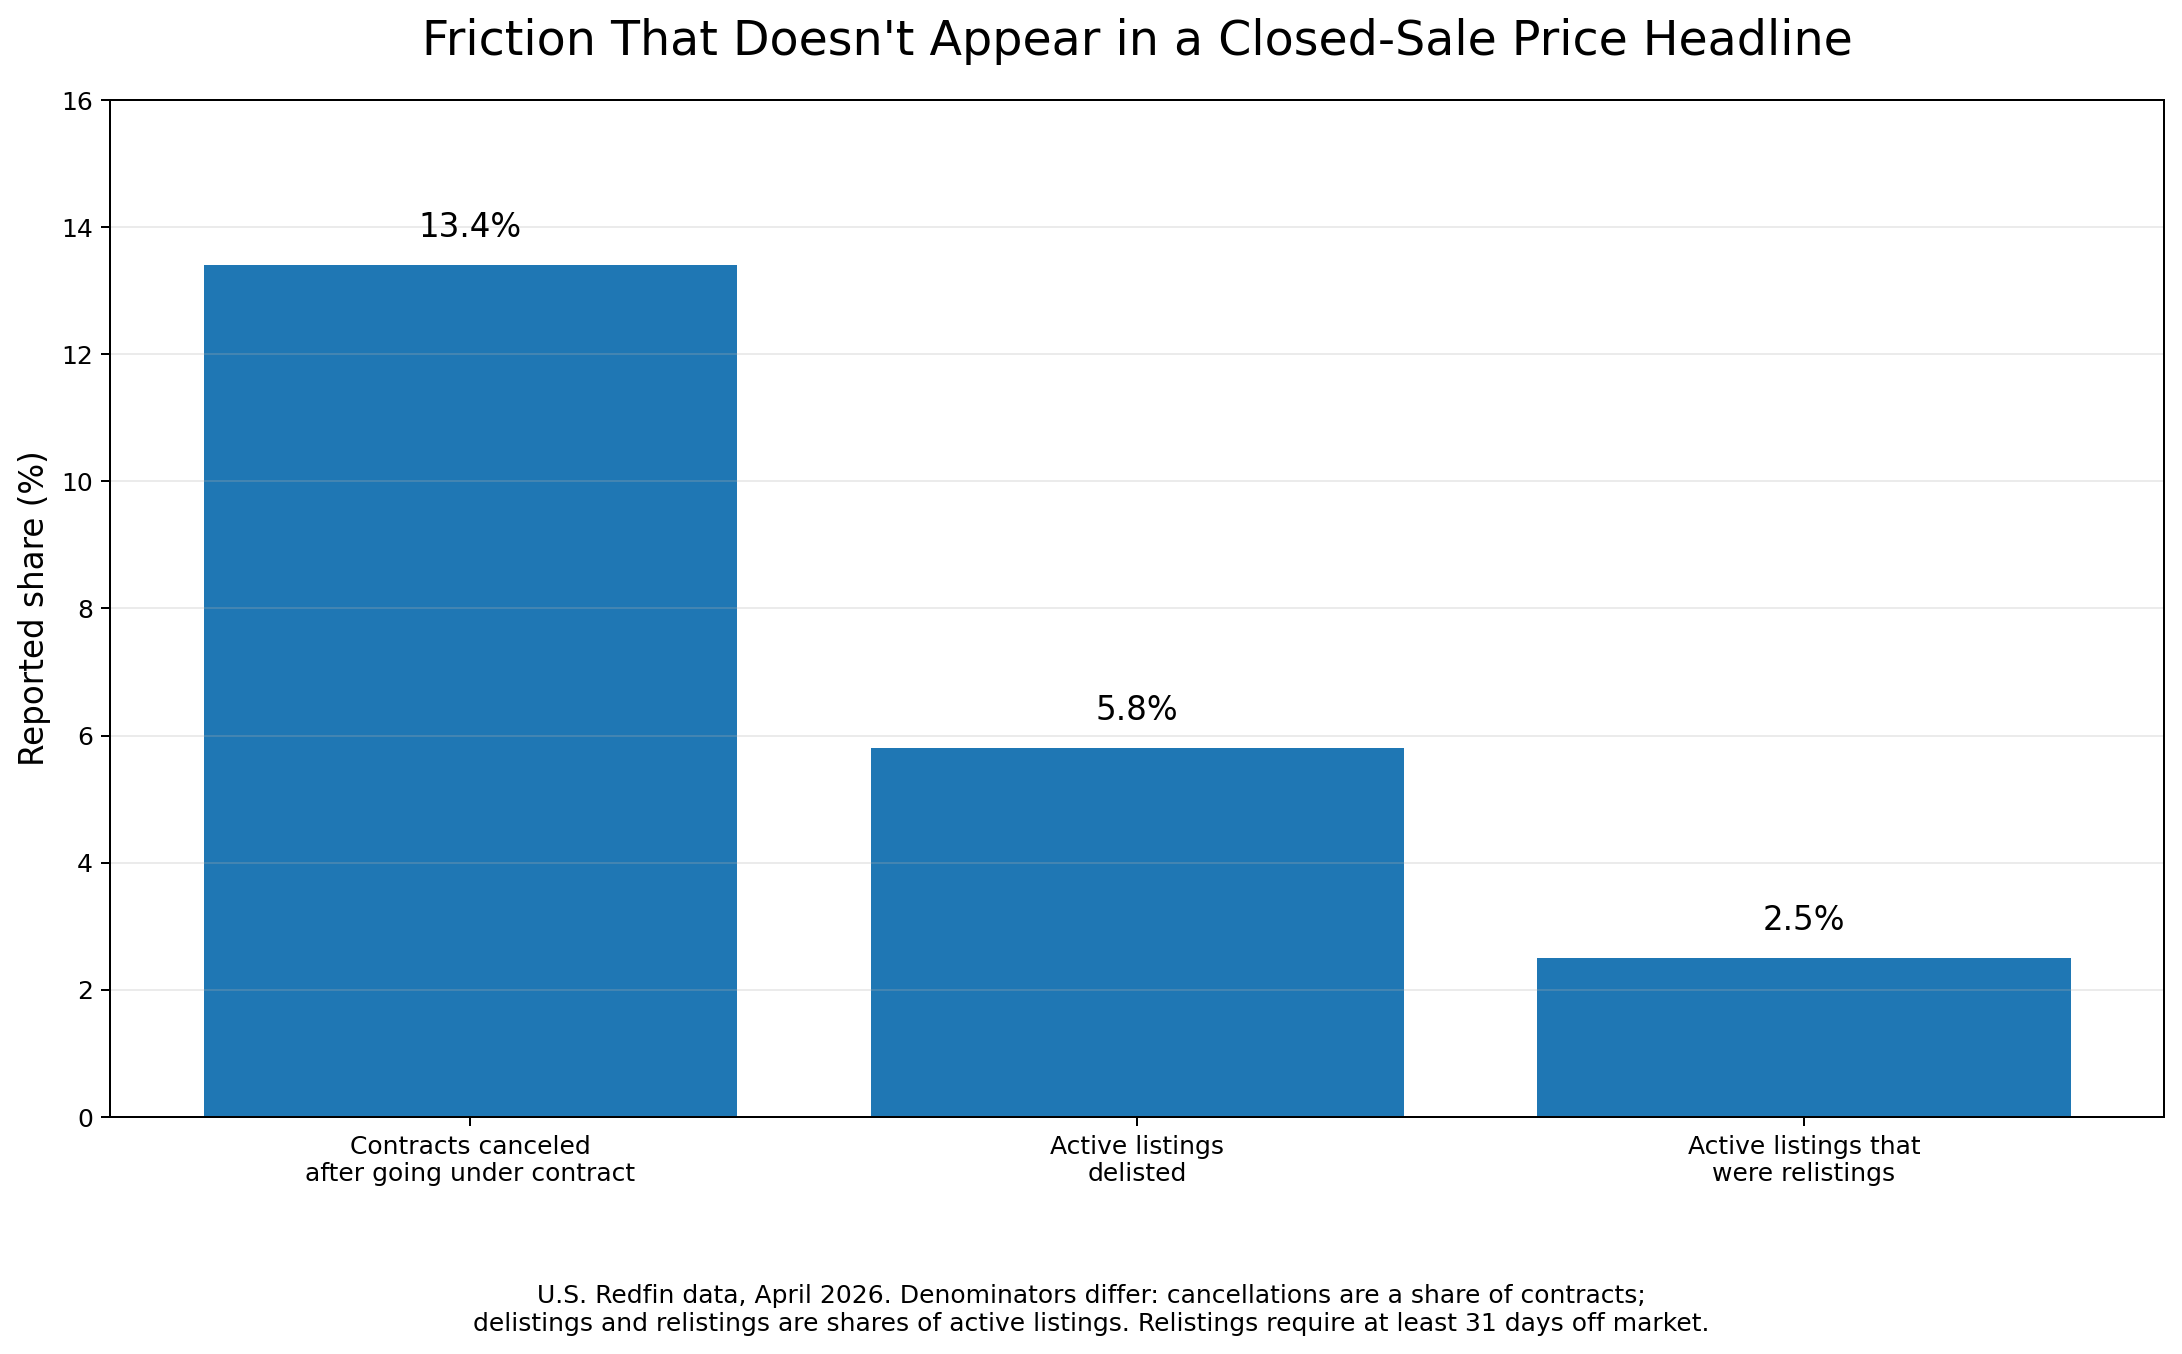
The figures in this graph have different denominators and shouldn’t be added together. Contract cancellations are measured against homes under contract. Delistings and relistings are measured against active listings. Together, they show how much activity occurs outside the clean closed-sale number. Relisting can also hide the true seller concession. Consider a house originally listed for $750,000. It receives no acceptable offers, disappears, and returns at $700,000. It eventually closes for $695,000.
A portal may report that it sold only $5,000 below its final asking price. Economically, the seller conceded $55,000 from the original expectation. The first price didn’t vanish from reality merely because an MLS record was refreshed. This doesn’t mean every relisting is dishonest. Listings expire, owners change agents, deals fail. Photos and descriptions are improved. A seller may briefly take the property off the market for repairs or personal reasons. But the final-list-to-sale ratio can make the discount look smaller than the full listing history suggests.
What Completed Local Sales Are Telling Us
Zillow reports that 53.3% of Kootenai County sales in May closed below their final list price. Only 17.8% sold above list. The remaining 28.9% sold at the final asking price. (Zillow)
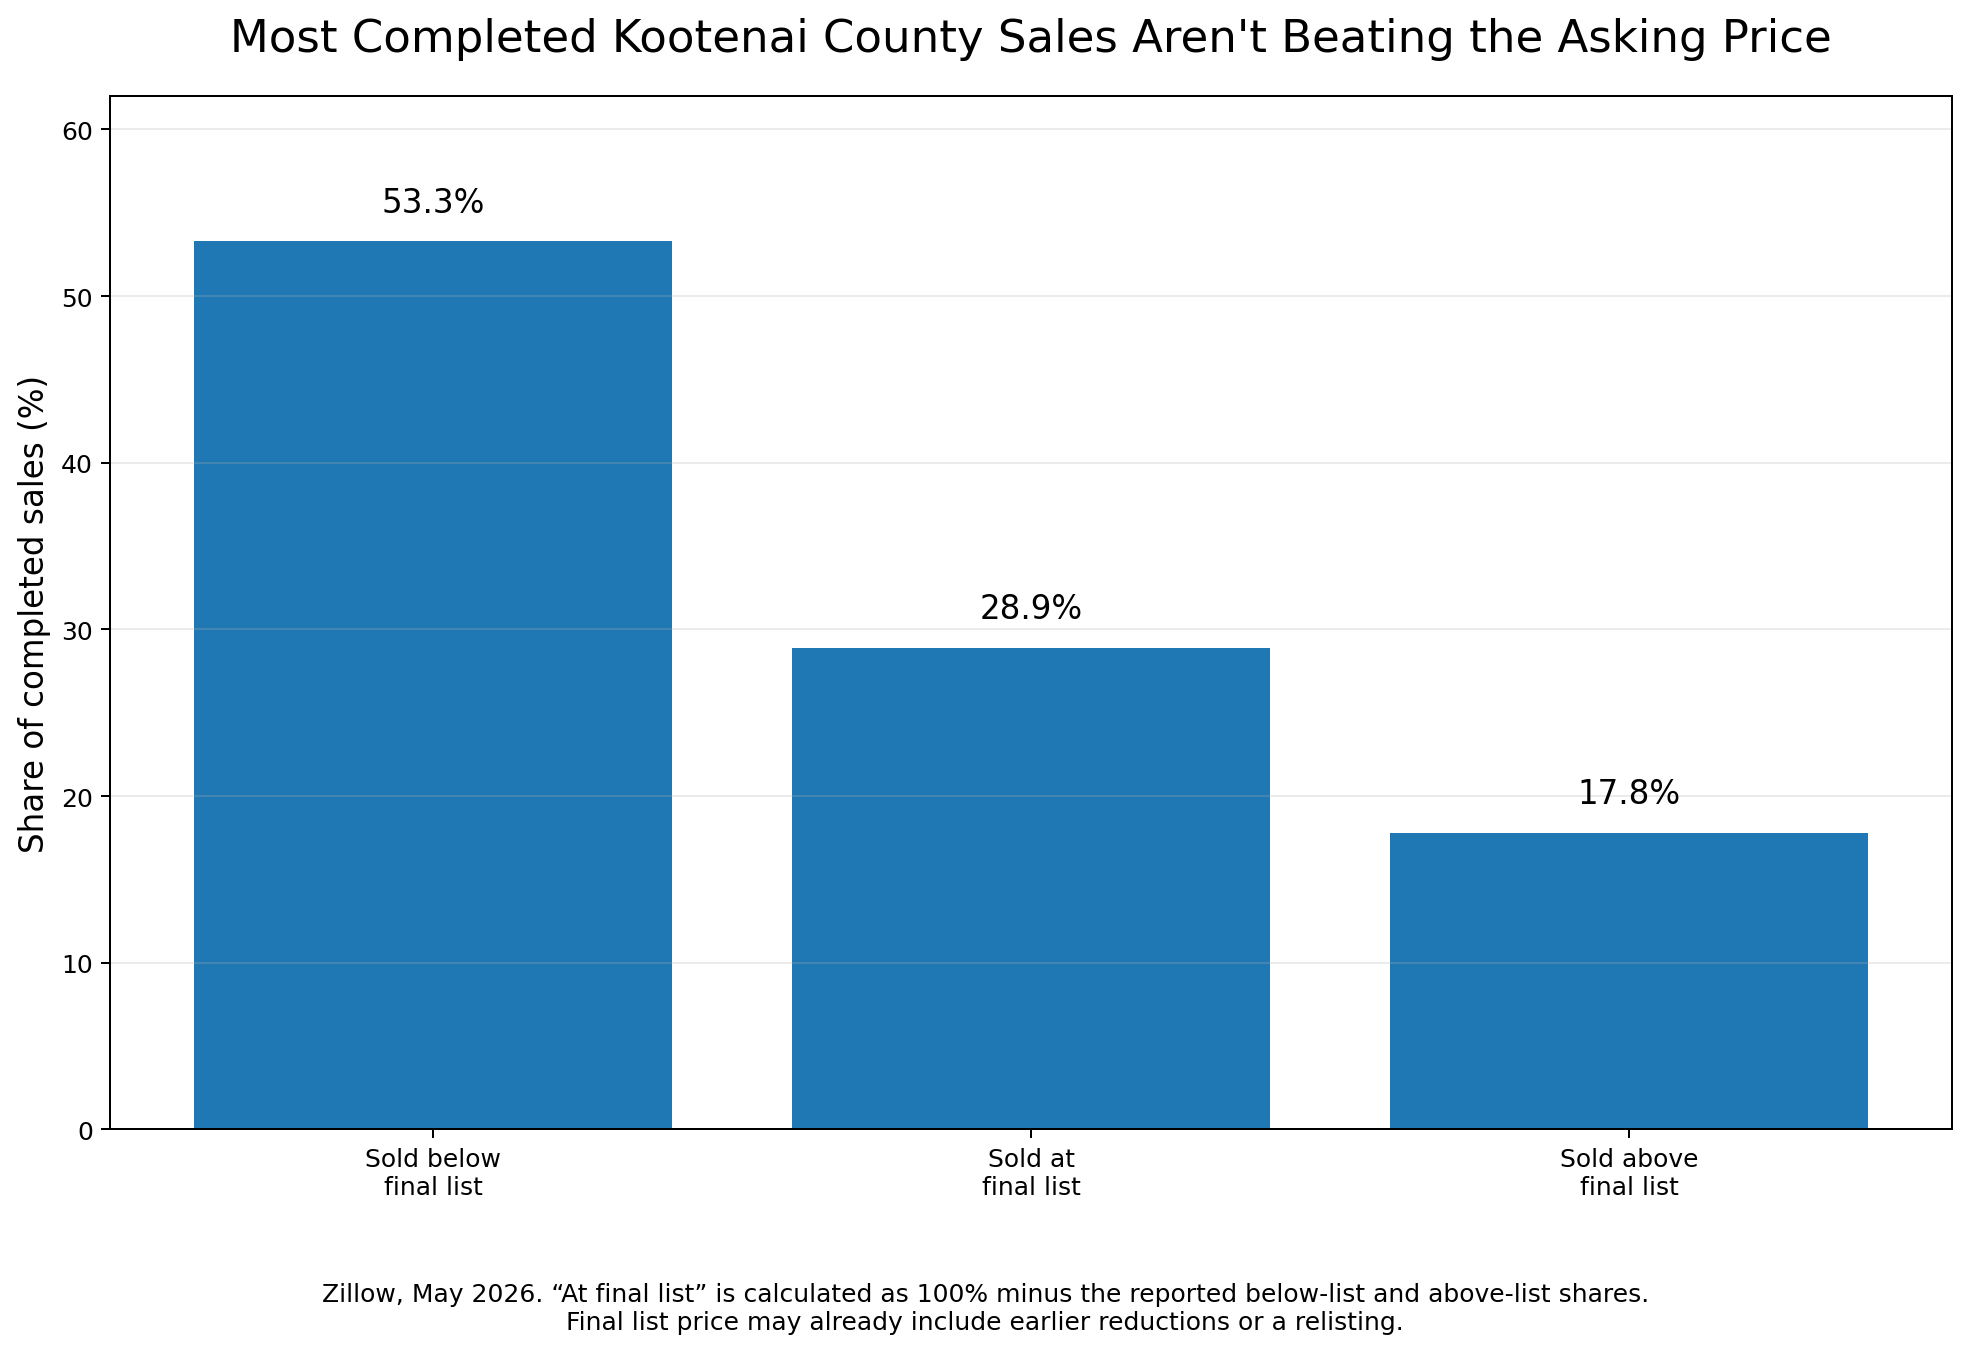
Redfin’s measurements point in the same direction. Its May sale-to-list ratio was 98.3%, only 17% of homes sold above asking, and 16.4% of active listings had recorded price reductions. (Redfin) These aren’t collapse figures. Sales are still closing, the local median remains elevated, and year-to-date volume has increased. The local REALTORS reported 1,246 completed single-family sales through June, 6.6% more than during the comparable period in 2025. (Coeur d’Alene Press)
More than half of completed buyers are already paying below the final asking price. That’s after any visible reductions, failed offers, relisting maneuvers or quiet concessions that occurred earlier.
Then There Are the Investors Who Can’t Do Math
The Athol property that started this discussion is a useful example. The four-bedroom, 1.5-bath house on 15 acres was listed for $889,900, recorded as sold on July 15, and offered for rent at $2,900 per month on July 23. The final sale price hasn’t been published on the major property pages I found. (Realtor)
If the buyer paid near the final asking price, annual gross rent would be $34,800. That’s a gross yield of about 3.91% before vacancy, taxes, insurance, maintenance, management, well repairs, septic work, road costs or the inevitable rural-property surprise waiting behind a shed. At the national 30-year mortgage average of 6.58% reported by Freddie Mac on July 23, a buyer putting 25% down on $889,900 would have principal and interest of about $4,254 per month. The advertised rent is $2,900. That leaves a $1,354 monthly deficit before paying a single operating expense. Freddie Mac’s published rate represents conventional owner-occupied lending to well-qualified borrowers, so using it for this illustration is already generous to the hypothetical investor. (Freddie Mac)
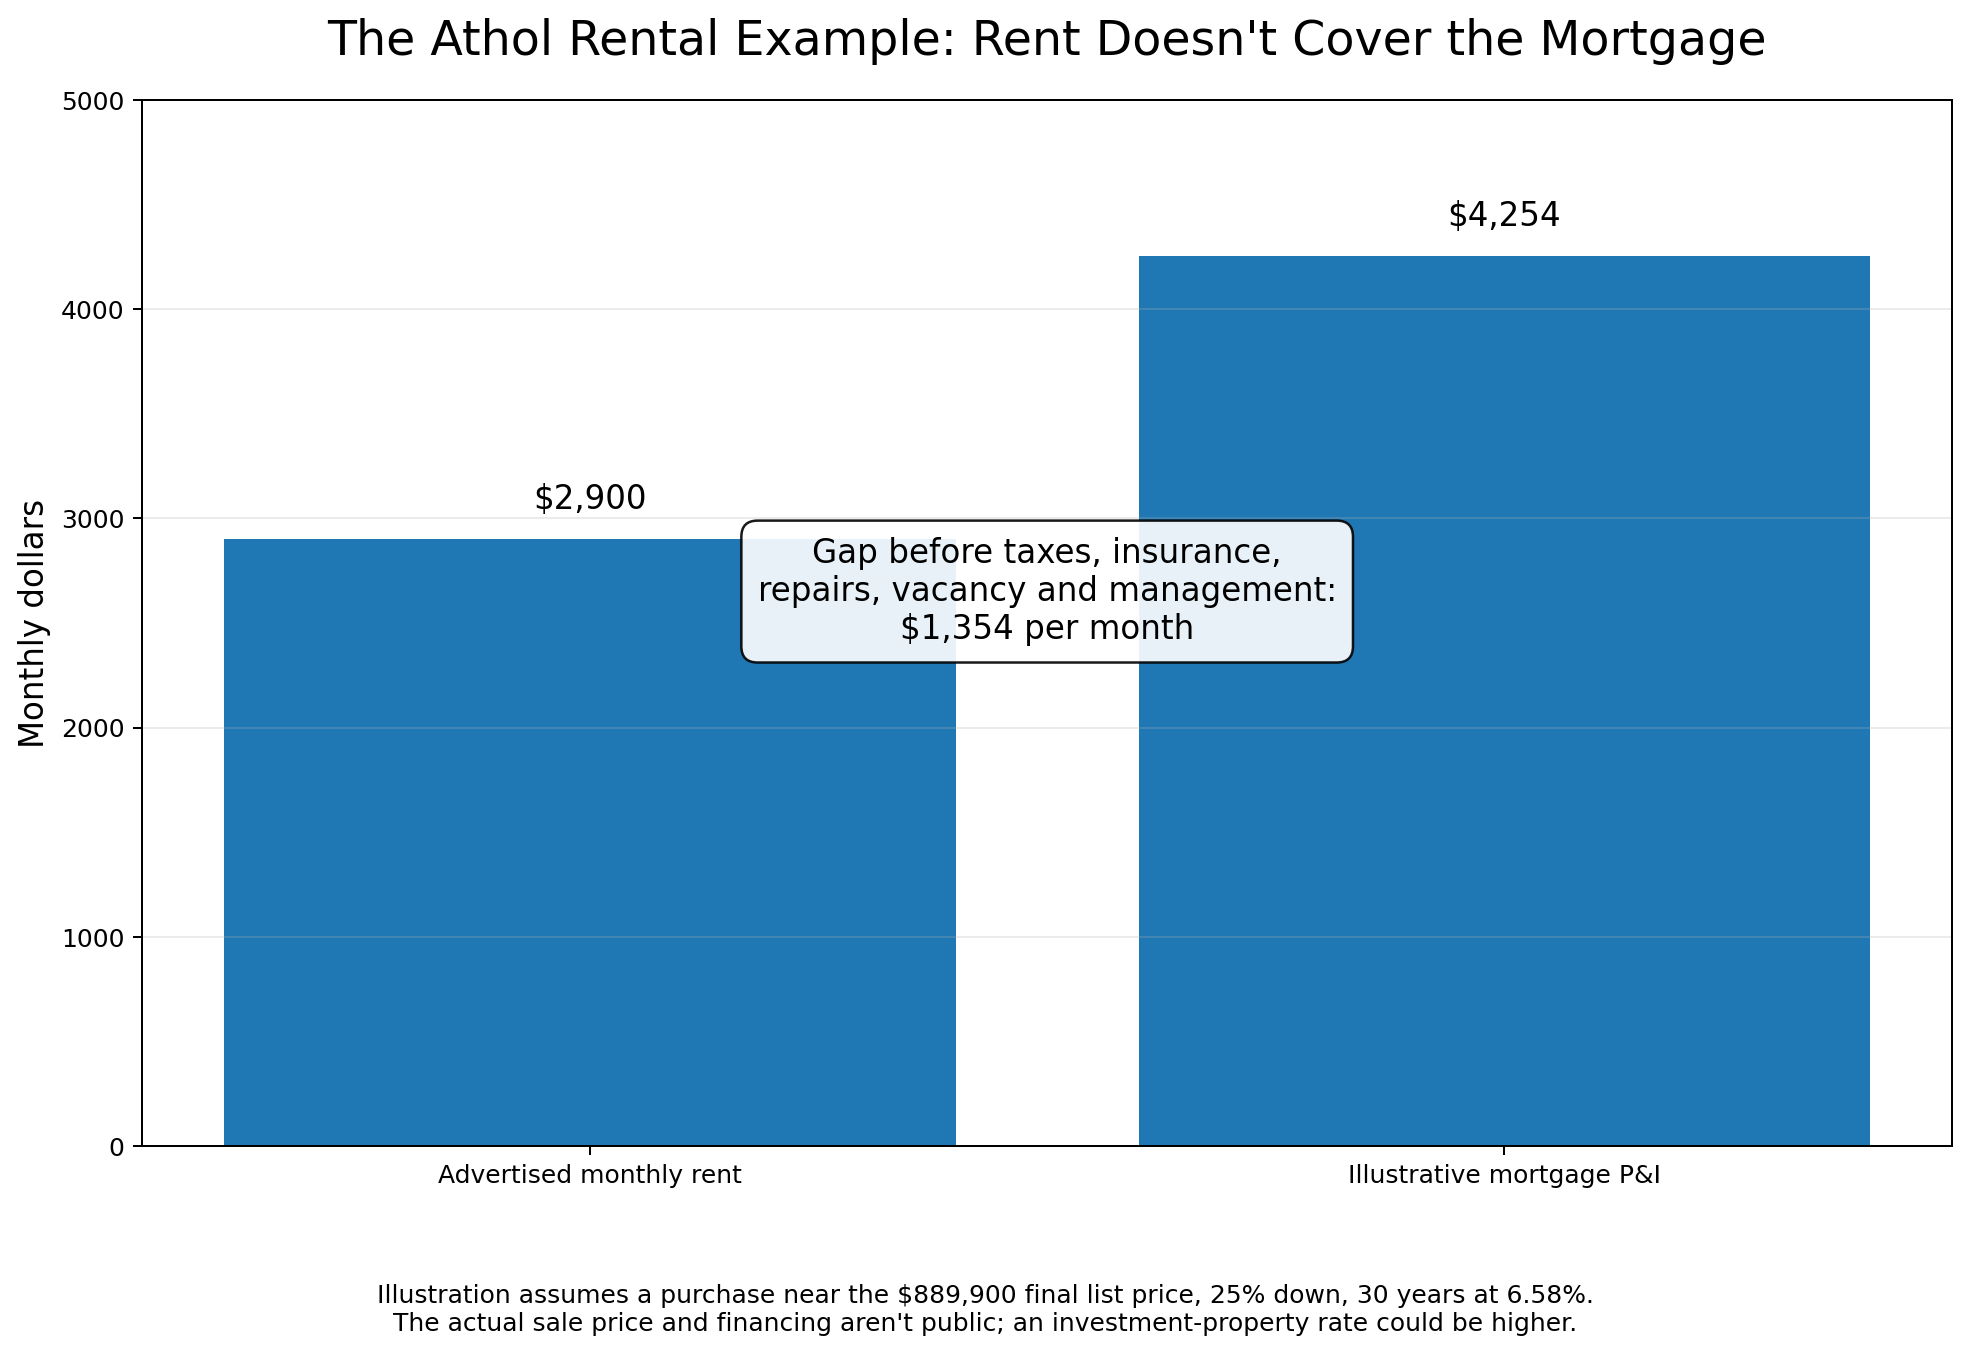
There are investors who can’t do math. More precisely, there are investors whose spreadsheet assumes appreciation will continue, rent will be whatever number makes the acquisition work, vacancy will be brief, maintenance will be polite, and the eventual buyer will pay even more than they did. That doesn’t fully explain this particular property.
The rental advertisement states that the owner intends to subdivide the rear portion of the land and build two more houses. The tenant would have use of approximately four front acres rather than the full 15 acres. The owner admits that the development timeline isn’t clear. (HotPads) The buyer therefore may not be treating the existing house as the entire investment. The rent could be intended to offset carrying costs while the owner pursues subdivision and construction.That’s development math rather than rental math.
It can still be bad math. The plan depends on subdivision approval, legal access, septic suitability, water, utility extensions, road standards, construction costs and the eventual value of two additional homes. The $2,900 rental income doesn’t make the original house work as a stand-alone investment. It merely slows the bleeding while the owner waits to find out whether the land plan works.
Who’s Going to Pay $2,900 in Athol?
A landlord using the common three-times-rent screening rule would require annual household income of about $104,400. A household keeping rent at 30% of gross income would need approximately $116,000. The tenant also has to want a rural 1977 house, accept 1.5 bathrooms for four bedrooms, maintain the property, tolerate well and septic systems, use a gravel road, and live beside future subdivision and construction activity.
The acreage and shop create value for a specific renter with dogs, livestock, trailers, equipment, an RV or a small contracting operation. They don’t create broad demand from ordinary renters.
That leaves a thin pool:
- Higher-income remote workers relocating to North Idaho
- Dual-income professional households
- Contractors or tradespeople who value the shop and storage
- Families temporarily renting while searching for a house to buy
- Rural-lifestyle renters with animals or equipment
The catch is that many households earning enough to pay $2,900 and interested in acreage would rather buy. The property needs one unusually suitable tenant, not merely one financially qualified tenant. It may find that person. The asking rent is still too fragile to support an acquisition anywhere near $889,900 without a separate land-development strategy.
Is Someone Deliberately Holding Up the Market?
There’s no need for an institutional conspiracy to explain the current numbers.Prices can remain sticky because sellers withdraw rather than accept a lower offer. Low transaction volume allows a small group of successful sales to determine the median. Expensive properties can increase their share of closings. Failed deals never enter the sale-price headline. Quick relistings can make stale inventory look new. Investors and developers may buy properties based on future plans rather than current rental income.
The result is a market where reported prices remain stable or rise modestly even while the probability of selling an overpriced property deteriorates. That’s different from saying the market statistics are fake. Zillow’s 2.4% is a modeled typical-value estimate. Redfin’s 5.2% is a median of completed transactions. The local REALTORS’ 3.9% applies to a narrower property class. Each number describes something real. None describes the entire process from the owner’s original asking price to the final disposition of every listing.
What’s Actually Going On
My reading of the evidence is:
- Kootenai County hasn’t entered a broad recorded-price collapse. Completed sale prices remain above last year’s reported levels, and sales volume has increased.
- The market is weaker than the appreciation headlines suggest. More than half of completed sales are below final asking price, and many unsuccessful listings never enter the median-sale calculation.
- Sellers are resisting lower clearing prices. Some cut prices openly. Others withdraw, wait, relist, change agents or try the rental market.
- Pending statistics overstate certainty. An accepted offer isn’t a completed sale, and a meaningful national share of contracts is failing.
- Relisting obscures cumulative weakness. A property’s final discount may look small when compared with its latest asking price even though the owner has conceded much more from the original listing.
- Unusual investor purchases don’t necessarily represent normal market demand. Some are development plays, land banks, future residences or appreciation bets. Some investors also can’t do math.
- The rural acreage market is thinner than the suburban market. County medians can’t tell us whether one unusual Athol property can sell or rent at its advertised price.