A recent ZeroHedge article, drawing on UBS Evidence Lab data, declares a collection of restaurant chains the winners of the second-quarter 2026 “social media war” for the attention of younger consumers. McDonald’s, Starbucks, and KFC reportedly dominated Instagram engagement. Chipotle and Wendy’s showed strong growth in interactions and likes. On TikTok, LongHorn Steakhouse increased followers by 167 percent, Applebee’s by 103 percent, and Outback Steakhouse by 75 percent. UBS examined followers, posts, interactions, and related measures to estimate brand visibility and consumer engagement.
Read the original ZeroHedge article.
Those numbers may be perfectly accurate, but they tell us remarkably little about whether these restaurants are actually winning. Restaurants are in the business of selling food to people at a price customers are willing to pay, often enough and at sufficient margin to make the restaurants profitable. Confusing these things with likes or survey results is a ticket to Chapter 11.
The Measurement Problem
The basic problem is that the analysis is measuring one variable and implicitly treating it as evidence about another.
Restaurant revenue = customer visits × average customer spending
Profit requires another layer:
Restaurant profit = revenue − food − labor − occupancy − operating costs
Social-media engagement appears in neither equation. It might influence customer visits, although our metrics show otherwise. The ZeroHedge article itself is careful enough to say brands with strong online communities may be “better positioned” to drive visits and cites research suggesting a correlation between online views and traffic.
Restaurants running major promotions may simultaneously generate more social-media activity and more sales. A successful new product or controversial advertising campaign can generate enormous engagement without generating customers. These chains experiencing declining sales are deliberately increasing promotional activity, creating the bizarre possibility that deteriorating business conditions cause social engagement to rise.
The Numbers Tell a Messy Story
| Restaurant | Social-Media Story | Recent Business Reality |
|---|---|---|
| Wendy’s | Strong Instagram interaction growth | U.S. same-restaurant sales fell 7.0% in Q2 2026, while net income fell from about $55.1 million to $32.6 million. |
| McDonald’s | One of the dominant Instagram brands | Q2 U.S. comparable sales rose only 0.8%, with negative comparable guest counts partly offset by higher checks. |
| Applebee’s | TikTok followers up 103% | Domestic same-restaurant sales fell 1.8%. Parent Dine Brands’ quarterly net income available to common shareholders fell from $13.2 million to $4.2 million. |
| Outback Steakhouse | TikTok followers up 75% | Outback comparable sales improved, but traffic remained under pressure. Parent Bloomin’ Brands’ quarterly net income improved materially. |
| Chipotle | Strong Instagram interactions and likes growth | Comparable restaurant sales rose 2.2% and transactions increased 1.0%, yet net income declined from $436.1 million to $403.5 million. |
| Starbucks | One of the Instagram engagement leaders | Comparable store sales and transactions improved strongly, but individual profit measures remain affected by restructuring and the China transaction. |
| LongHorn Steakhouse | TikTok followers up 167% | LongHorn same-restaurant sales rose 7.2%, even as parent Darden’s quarterly net earnings declined year over year. |
That table is tells an important story. The same social metric identifies Wendy’s, where the operating picture is deteriorating, and LongHorn, where restaurant-level sales growth is strong. It identifies Applebee’s, where comparable sales declined, and Chipotle, where transactions improved. A useful predictor should help separate winners from losers, but social media engagement doesn’t.
Social Buzz vs. Profit Growth
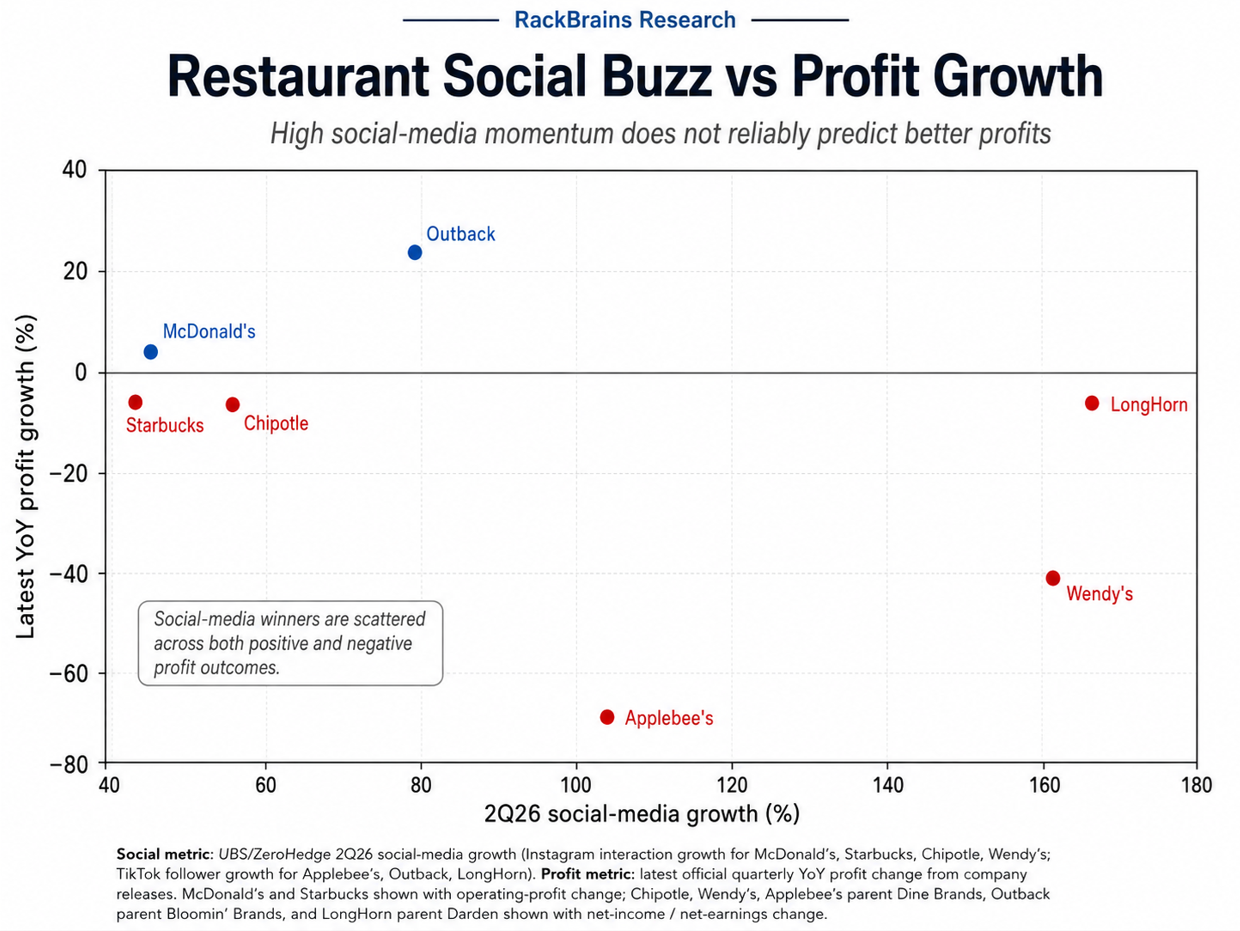
Figure 1. Social-media growth among selected restaurant brands compared with the latest available year-over-year profit change for their public parent companies. The scatterplot illustrates the central problem: strong social-media momentum appears alongside both improving and deteriorating profit outcomes.
This chart makes the weakness of the supposed relationship visible. Wendy’s generated enormous growth in social engagement while quarterly net income fell sharply. This is apparent at our local Wendy’s down the street, which is across the street from an In-N-Out. The Wendy’s drive through and parking lot are always empty, the In-N-Out drive through has cars wrapped around the street. Applebee’s more than doubled its TikTok following while parent Dine Brands saw net income fall dramatically.
LongHorn produced some of the largest follower growth in the dataset while its parent company’s quarterly earnings were slightly lower than the previous year. Meanwhile, Outback’s parent company posted substantial profit improvement with much more modest social-media growth. The scatterplot looks exactly like what we should expect when two variables have only a weak and highly conditional relationship. TikTok follower growth tells us essentially nothing about that dynamic.
The Real War Is Over Value
The more consequential story is the widening gap between what restaurants charge and what customers believe they are receiving. Restaurant prices have risen considerably faster than many consumers’ incomes and, over portions of the recent inflationary period, faster than grocery prices. Eating at home is increasingly attractive relative to eating out, and the problem becomes particularly interesting when we look at the same younger consumers whom the social-media campaigns are supposedly capturing.
Restaurants may be reaching Gen Z on their phones but they’re struggling to convince them that a restaurant meal represents good value. The customers are saying: I saw your marketing. I know your brand. I understand your promotion. That meal is NOT worth what you’re charging. Social-media strategy won’t gaslight that.
Fast Food Is Losing Its Historical Bargain
For decades, the economic proposition behind fast food was easy to understand: fast, predictable, convenient, and cheap. Inflation has destroyed the cheap pillar. This creates a serious structural problem for the traditional quick-service model.
McDonald’s: Millions of Followers Aren’t Buying
McDonald’s demonstrates the difference between brand visibility and customer experience particularly well. Its brand awareness is effectively universal, yet its latest U.S. results showed comparable sales growth of only 0.8 percent, with positive check growth partly offset by negative comparable guest counts.
Follower Growth Is Particularly Misleading
Percentage follower growth is one of the weakest metrics in the original analysis, LongHorn increasing TikTok followers by 167 percent sounds spectacular. Applebee’s increasing followers by 103 percent sounds nearly as impressive. But percentages without denominators are treacherous. But without engagement rates, unique users, demographic composition, geographic matching, and conversion behavior, percentage growth is pure decoration.
What a Serious Analysis Would Measure
A useful study could actually determine whether social-media success translates into restaurant performance. Instead of ranking companies by interactions and calling them winners, researchers should compare changes in social engagement against subsequent changes in transaction counts.
Analysts need to control for:
- Menu-price changes
- Discounts and promotions
- New restaurant openings
- Regional economic conditions
- Seasonality
- Advertising spending
- Product launches
- Loyalty-program activity
Geographic exposure to campaigns should be compared against local restaurant traffic. Most importantly, the dependent variable should be something economically meaningful:
- Transactions
- Customer traffic
- Repeat visits
- Real sales after inflation
- Customer retention
- Restaurant-level margins