Technical paper
What happens to a population when the ecological pressures surrounding it change? Nature is not controlled by a single variable. Resources, predators, disease, crowding, physiology, behavior, reproduction, and mortality interact through feedback loops. A change in one part of the system can travel through several others before appearing as population growth, stabilization, recovery, or collapse. The Hormonal-Social Adaptation Population model, or HSAP, is an agent-based simulation designed to explore one possible class of these feedbacks. It examines whether environmental conditions can alter endocrine state, whether endocrine changes can affect behavior and reproduction, and whether those effects can influence population dynamics.
HSAP is not a prediction of what any particular animal population will do. It hasn’t been empirically calibrated or validated. It’s a computational laboratory for turning a proposed mechanism into explicit assumptions, measurable outcomes, and falsifiable predictions.
Real ecosystems are networks of interacting pressures:
- available resources
- population density
- reproduction
- social behavior
- stress responses
- competition
- environmental threats
A small change in one part of the system can ripple through the entire population. The Hormal-Social Adaptive Pressure (HSAP) model is a computational experiment designed to explore this idea. It isn’t intended to predict the future of any particular species or human population. Instead, it asks a simpler question: If biological systems contain interacting feedback loops, what kinds of population behaviors emerge when those loops are simulated over time?
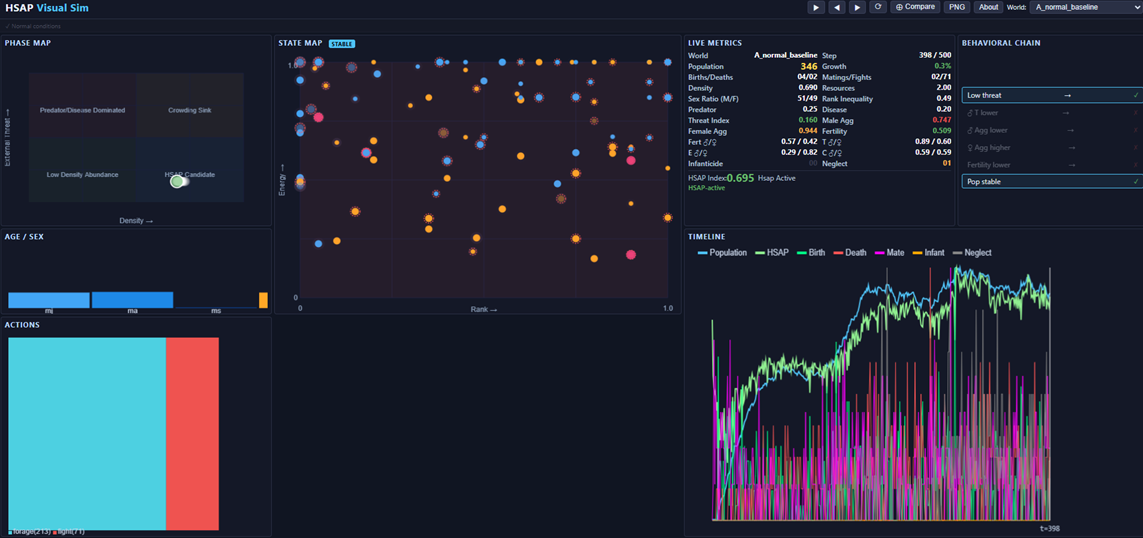
To explore that question, I built an evolutionary simulation where populations can stabilize, expand, enter stress states, recover, or collapse. The HSAP Simulation: A Virtual Ecosystem The interactive simulation allows you to watch the model evolve step by step. Each simulated population contains interacting components:
- Population size
- Population density
- Fertility
- Male and female behavioral variables
- Hormonal response proxies
- Environmental pressure
- Recovery mechanisms
The model doesn’t say: “Variable X causes outcome Y.” Instead, it asks: “What happens when these systems interact repeatedly over many generations?” Think of it as a wind tunnel for evolutionary ideas. Engineers do not put an airplane in a wind tunnel because they believe the tunnel is the sky. They use it to isolate forces and understand how systems behave.
The Basic Architecture of the Model
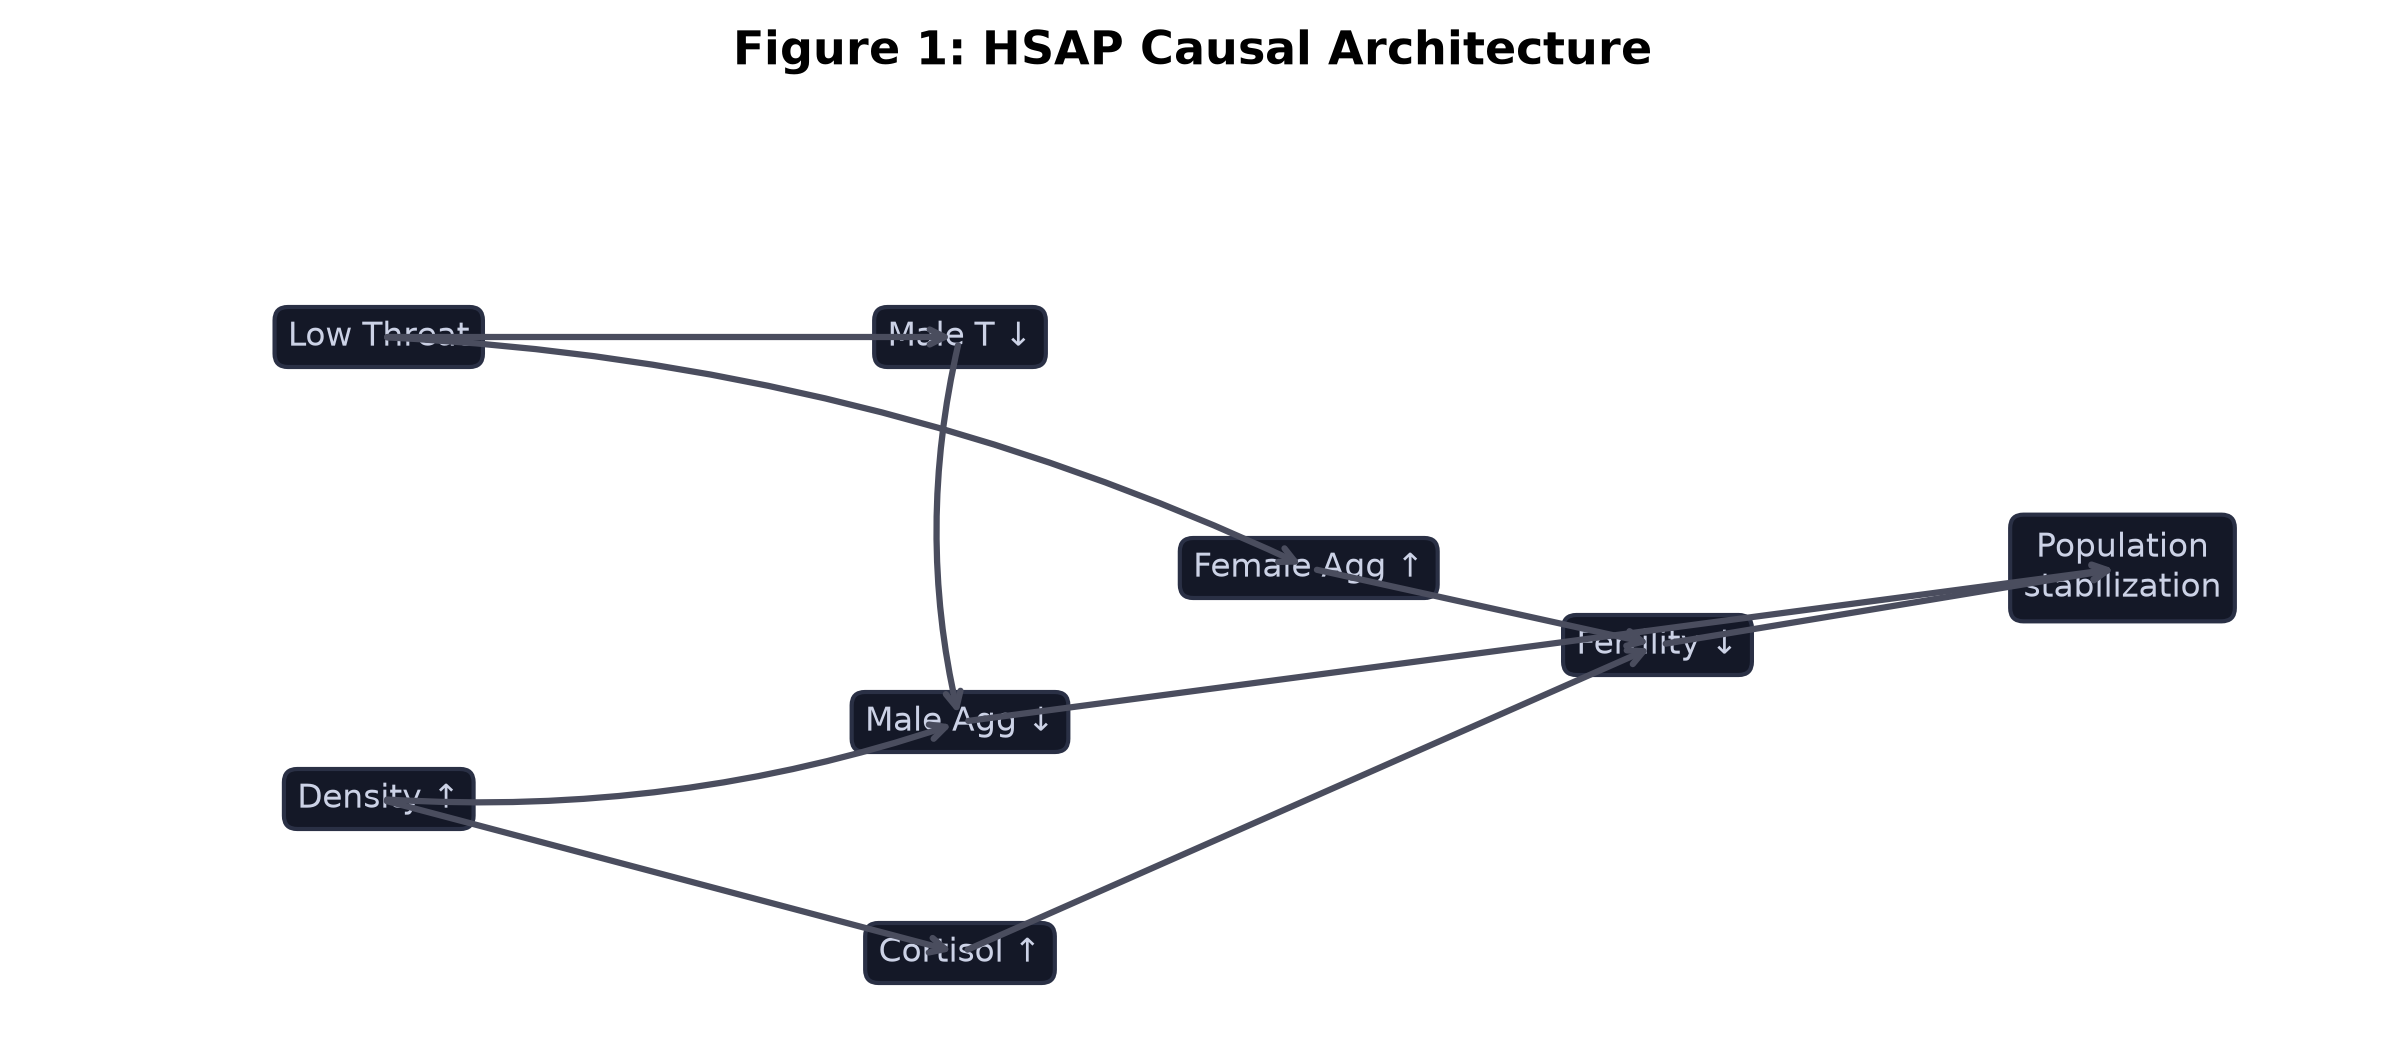
The first figure shows the basic structure of the simulation. At the center is the population, around it are interacting systems:
- environmental threat
- density pressure
- endocrine response
- behavioral response
- reproductive success
The important feature is feedback.For example:
A population grows.
↓
Density increases.
↓
Competition increases.
↓
Stress responses change.
↓
Behavior and reproduction shift.
↓
Population growth slows.
This creates a feedback system rather than a simple cause-and-effect chain.
Testing Different Worlds
A major advantage of simulation is that we can create controlled experiments. Instead of asking: “What happened in nature?” we ask: “What happens if we remove or change one mechanism?” The model was tested under multiple scenarios:
- Baseline Normal population dynamics
- Abundance Increased resource availability
- Crowding High population density
- Predation Increased external pressure
- Recovery Behavioral sink followed by recovery
- Partial collapse Stress overwhelms recovery
The goal was not to find one “correct” answer. The goal was to discover which behaviors emerge under different assumptions.
Population Trajectories: Stability, Growth, Collapse, Recovery
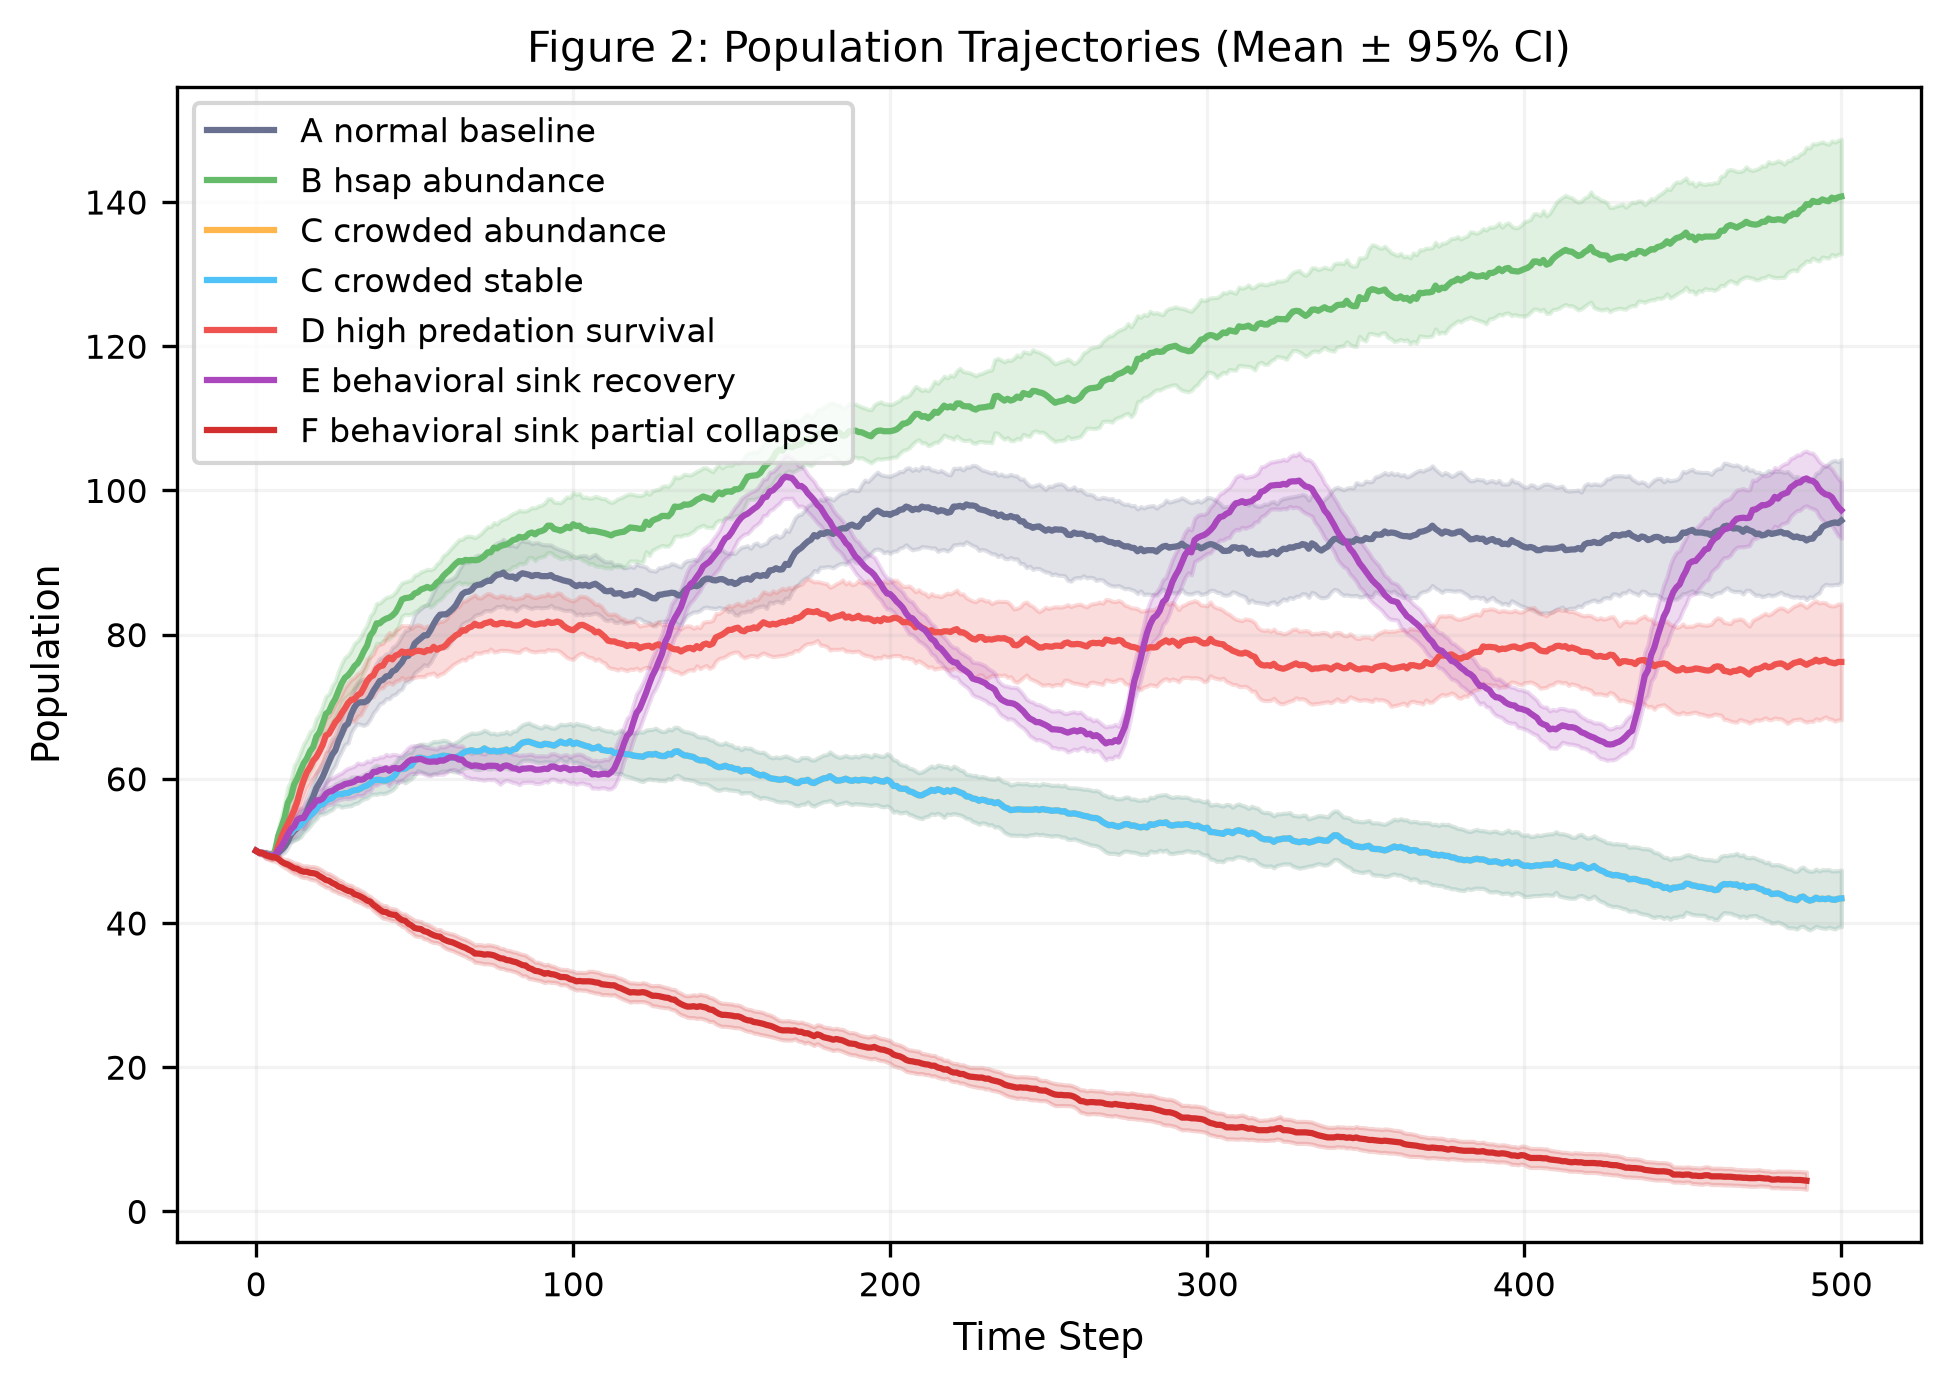
This graph shows several simulated populations over time, the colored lines represent different environments. Some important patterns appear:
Abundance scenario: The green line increases steadily and the population has enough resources and avoids major limiting pressures. This is the easy mode of the ecosystem.
Crowded environments: The blue line initially grows, then slowly declines. This represents a population that exceeds its comfortable operating range. The system does not immediately collapse. Instead, it slowly adjusts. This is important because many biological systems fail gradually rather than suddenly.
Behavioral sink recovery: The purple line shows one of the most interesting results. The population enters a stressed state, declines, then recovers. The model contains a recovery mechanism that allows the population to move out of the degraded state. This demonstrates a key ecological idea: Collapse is not always irreversible.
Partial collapse: The red line shows a population that cannot recover. The important result is not that collapse occurs, . Collapse is easy to create in simulations. The interesting question is: Which mechanisms allow recovery, and which prevent it?
Searching for the Important Variables
One challenge in complex models is determining which parts actually matter. If removing a component changes nothing, that component may not be important. If removing a component destroys the model’s behavior, it may represent a critical mechanism. The simulation compares the full HSAP model against simplified versions.
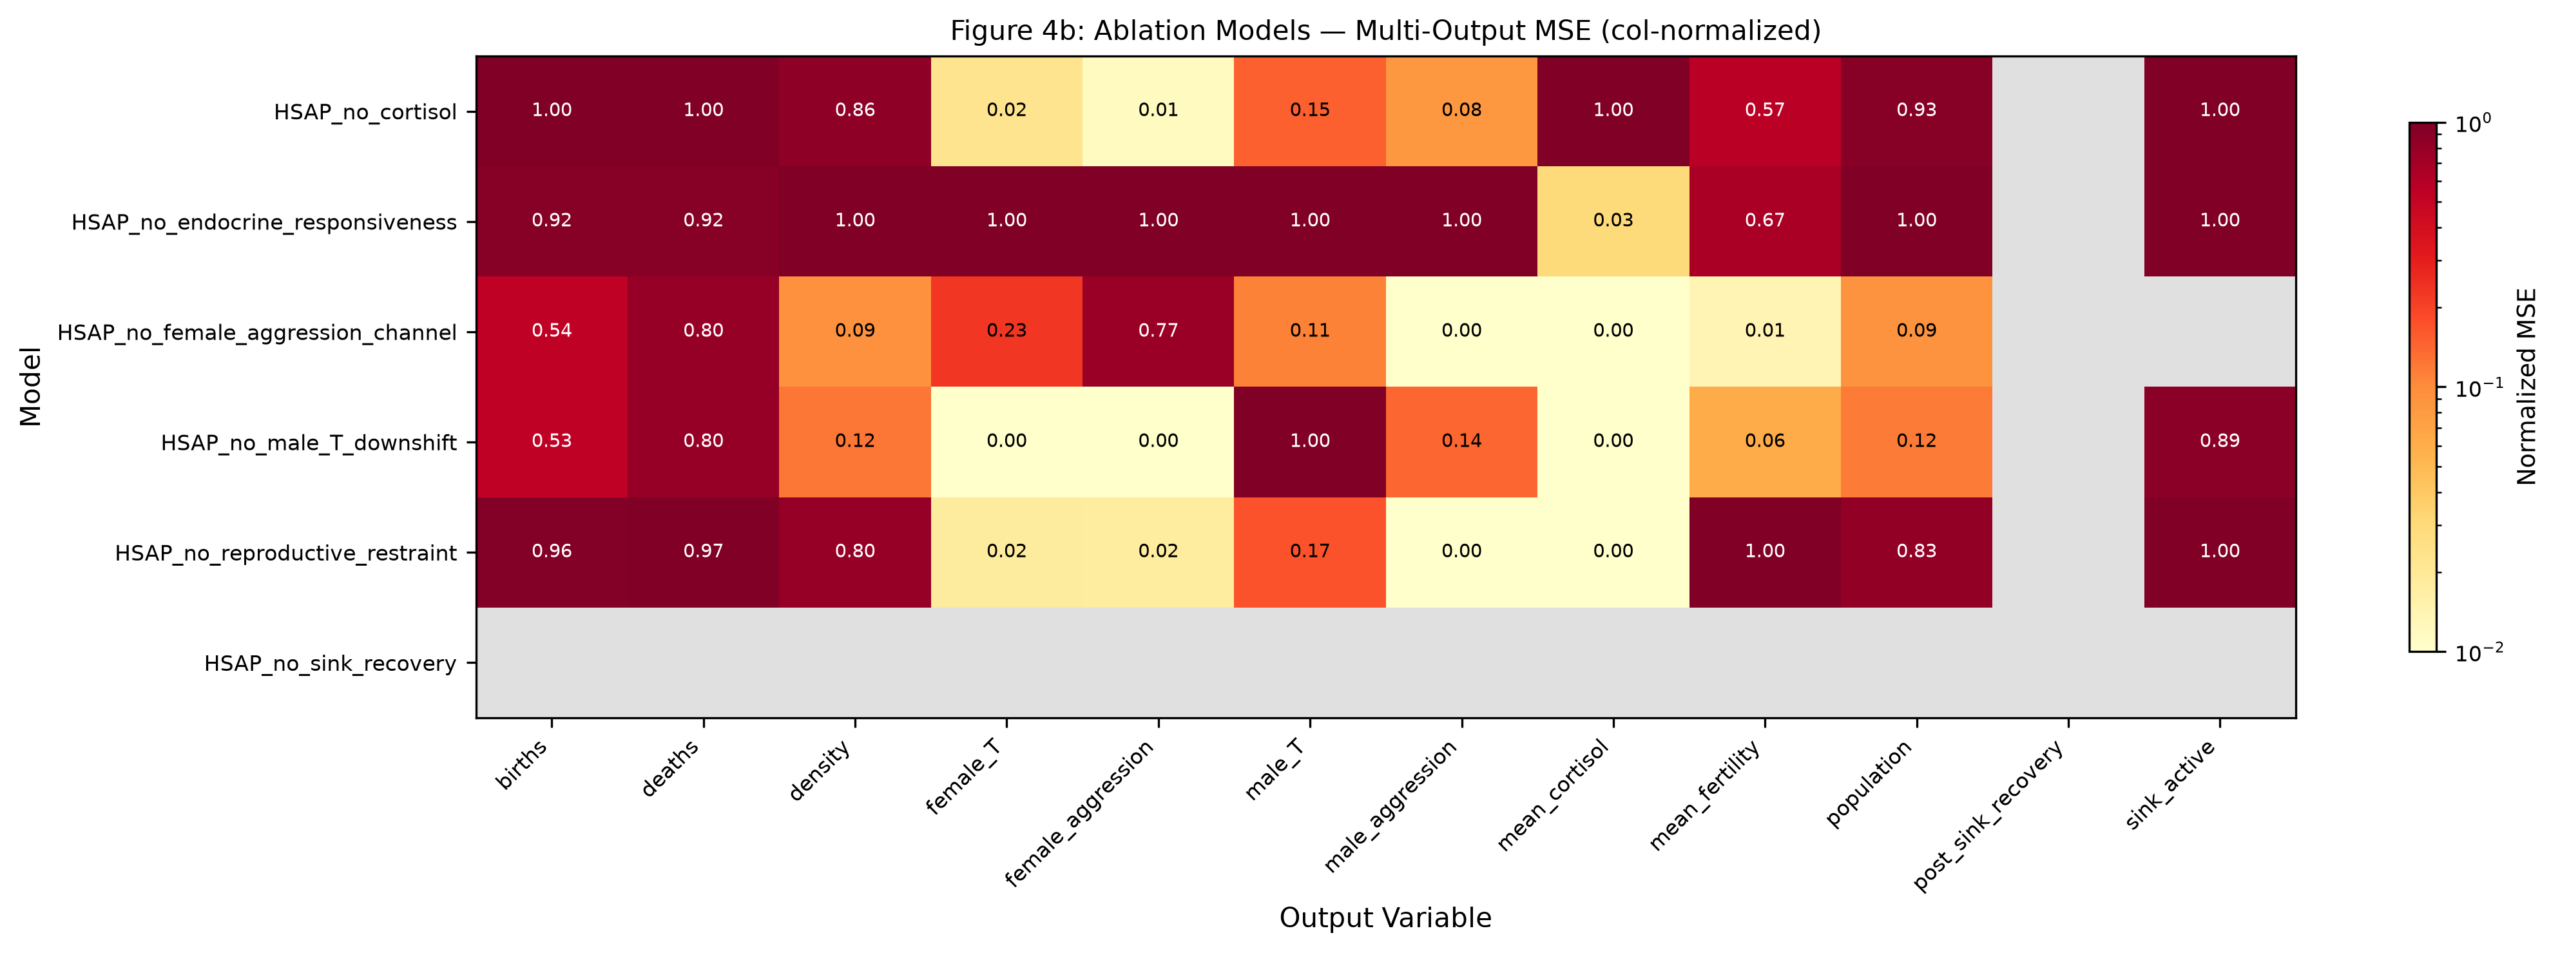
This heat map compares different versions of the model. Each square represents how differently a simplified model behaves compared with the full model. Dark regions indicate large differences, light regions indicate similar behavior. The takeaway: Some components strongly influence the simulated outcomes. Others have much smaller effects. This doesn’t prove that any biological mechanism is important in the real world. It only identifies which assumptions are important inside this model.
Testing Against Simpler Explanations
A good scientific model must survive comparison against alternatives. A common mistake in modeling is building a complicated system that explains everything because it contains everything. The HSAP model was compared against simpler “null models.” These included:
- random behavior models
- resource-only models
- density-only models
- predator-prey models
The question was: “Does adding additional interacting mechanisms produce behavior that simpler models cannot reproduce?”
What About Real Biological Data?
The model also explores whether measurable biological signals could be connected to these mechanisms. The paper discusses possible observational approaches:
- endocrine measurements
- behavioral measurements
- demographic trends
However, the model makes an important distinction: A correlation is not a mechanism. A graph showing two things changing together does not prove one causes the other. The purpose of the model is to generate hypotheses that could eventually be tested.
What Did We Learn?
The biggest lesson from the HSAP simulation is not a single number or prediction. It’s that complex systems often behave differently than expected. Three ideas stand out:
- Populations are feedback systems
Small changes can amplify or dampen through multiple interacting pathways.
- Collapse and recovery are different processes
The mechanisms that cause decline are not necessarily the same mechanisms that allow recovery.
- Simulations are tools for asking better questions
A model isn’t a replacement for observation.It’s a machine for turning vague ideas into specific predictions.
1 comment on “When Populations Change: Exploring Evolution, Behavior, and Survival With the HSAP Simulation”