What the Data Says
A recent article making the rounds under the title Society Collapse 2040: The Year the World Stops Working and Starts Dying resurrects one of the most famous computer models ever built.
The argument traces back to The Limits to Growth, the 1972 study commissioned by the Club of Rome and performed by researchers at MIT. Using a system dynamics model called World3, the researchers examined interactions among population, industrial production, food production, pollution and consumption of nonrenewable resources. More than fifty years later, the model still generates controversy because the broad trajectory of several of its scenarios looks disturbingly familiar.
But there is an important difference between saying that the world is encountering physical limits and saying that civilization will collapse in 2040. After examining the original research, subsequent updates and current data on population, agriculture, groundwater, food production, industrial output and pollution, my conclusion is that the Limits to Growth thesis has aged considerably better than the 2040 headline. The model identified several genuine structural problems, but it didn’t establish a scientifically defensible expiration date for industrial civilization.
First, There Is a Problem With the Article Itself
Before analyzing the model, we need to separate the research from what has been added to it. The ZeroHedge article says that a new KPMG reassessment published in January 2026 examined thirty indicators, found twenty-seven running worse than the original projections and concluded that systemic rupture was now likely between 2032 and 2038. I couldn’t find the primary KPMG report supporting that claim. The identifiable KPMG connection is Gaya Herrington, who worked at KPMG and published a peer-reviewed analysis of World3 in the Journal of Industrial Ecology. That research appeared in 2020 online and in the journal in 2021. Herrington compared ten variables, not thirty:
- population
- fertility
- mortality
- food per capita
- industrial output per capita
- services per capita
- nonrenewable resources
- persistent pollution
- human welfare
- ecological footprint
Her research didn’t say that twenty-seven of thirty indicators had exceeded the 1972 projections. Nor did it announce a newly calculated 2032 to 2038 collapse window. More importantly, Herrington explicitly described World3 as a scenario model rather than a point forecasting system. The original Limits to Growth researchers said essentially the same thing. The curves were intended to demonstrate possible system behavior, not predict what would happen on a particular Tuesday in 2040.
That distinction gets lost when a systems model becomes an Internet apocalypse clock.
What Herrington Actually Found
Herrington compared real-world data with four World3 scenarios: the traditional Business as Usual scenario, or BAU, eventually collapses because increasingly scarce nonrenewable resources consume more industrial capacity. BAU2 assumes substantially greater resources. In that scenario, civilization avoids the immediate resource constraint but eventually encounters a pollution constraint. Comprehensive Technology, or CT, assumes very aggressive technological improvements. Stabilized World, or SW, combines technological progress with deliberate changes intended to stabilize population and material consumption.
Herrington found that the empirical data most closely resembled BAU2 and CT. The two scenarios don’t have the same outcome. BAU2 eventually produces a severe collapse, CT produces declining industrial and agricultural output but something closer to a soft landing than civilizational collapse. Herrington herself wrote that only one of the two closest-fitting scenarios depicted collapse. That’s a much more cautious conclusion than “MIT predicts civilization will end in 2040.”
A Newer World3 Test
There’s a more recent peer-reviewed update that deserves considerably more attention than the supposed 2026 KPMG study. In 2024, Arjuna Nebel and colleagues published a recalibration of World3 using approximately fifty additional years of empirical data. They optimized 35 model parameters against eight empirical datasets. Their recalibrated model again produced the familiar overshoot-and-decline pattern. Their results fit the original BAU scenario somewhat better than BAU2 and suggested major turning points beginning in roughly the 2024 to 2030 period. That sounds supportive of the collapse thesis until you read the limitations.
The authors explicitly warned that the two sectors most responsible for determining the collapse mechanism, nonrenewable resources and pollution, were among the hardest variables to match accurately. They therefore stated that the timing of the peak cannot be relied upon. There’s another statistical issue; when 35 parameters are adjusted to improve the fit to historical data, the resulting historical agreement is not an independent forecast validation. It demonstrates that the structure of World3 can be calibrated to reproduce important characteristics of the historical record.
The Physical Variables
Are the physical constraints that would cause an overshoot actually getting worse? On several measures, the answer is clearly yes. But on most, the evidence is surprisingly weak.
Arable Land: Real Pressure, Misleading Description
The amount of arable land available per person has fallen dramatically. World Bank data derived from FAO statistics put global arable land at roughly 0.30 hectares per person around 1972. By 2023 it was approximately 0.17 hectares. That’s a decline of roughly 42 percent per person. At first glance this looks exactly like a Limits to Growth constraint. But this is misleading.
The physical amount of cropland has not simply disappeared. FAO reports that global cropland actually expanded by about 78 million hectares between 2001 and 2023. What happened is that population grew much faster than the agricultural land base. That produces exactly the kind of per-capita resource pressure that World3 was concerned about, but through a different mechanism than the phrase “land depletion” suggests. There’s also a more serious problem hiding underneath the acreage numbers: degradation.
FAO’s 2025 analysis estimates that around 1.7 billion people live in areas where human-caused land degradation has reduced crop yields. So the land constraint scoring should be:
World3 concern: substantially validated.
Doomsday interpretation: overstated.
We’re squeezing more production from less land per person, and some of that productive base is deteriorating. But global farmland is not disappearing on a trajectory that independently implies a 2040 collapse.
Groundwater: This Metric is A Problem
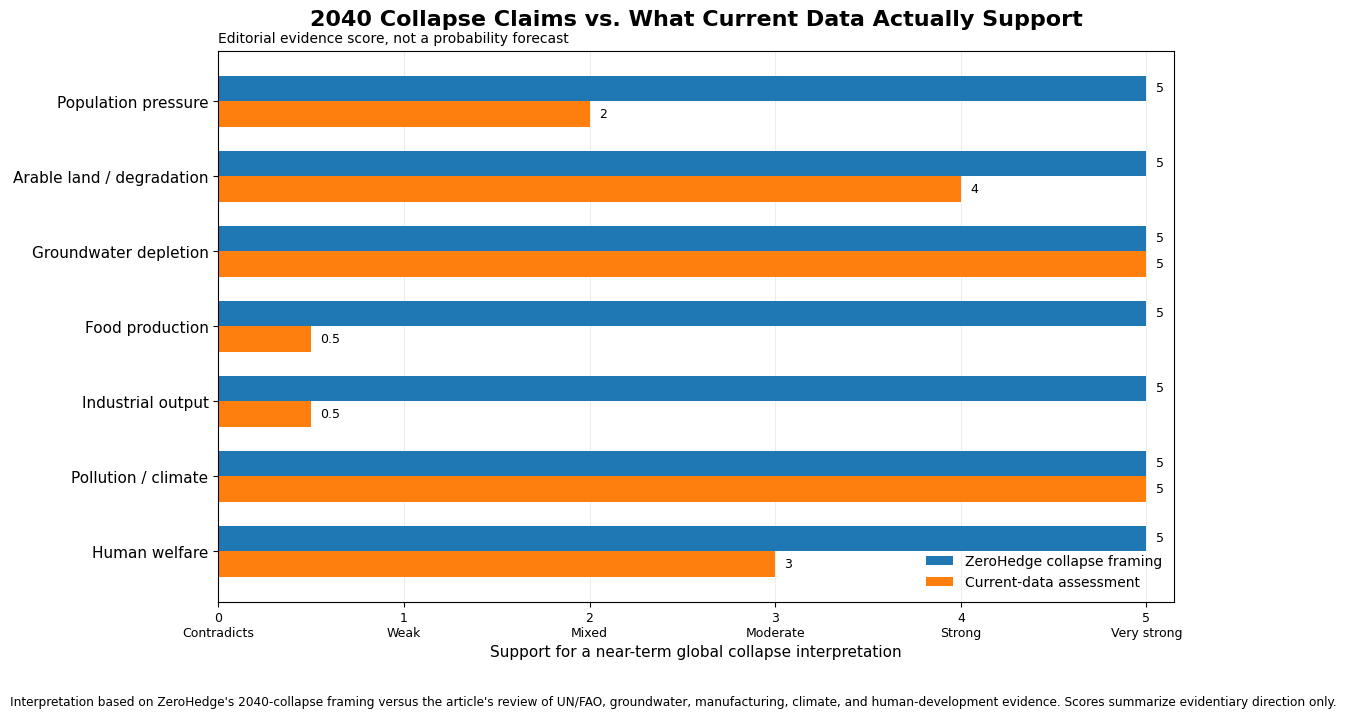
Groundwater is a different story, a major 2024 Nature study analyzed approximately 170,000 monitoring wells across 1,693 aquifer systems. Rapid groundwater declines exceeding half a meter per year were widespread, particularly in dry agricultural regions. More troubling, groundwater decline had accelerated over the preceding four decades in about 30 percent of the regional aquifers studied.
Another modeling study found that nonrenewable groundwater withdrawals reached a peak-and-decline pattern in 98 percent of its future scenarios, with the average global peak occurring around mid-century. Approximately 44 percent of the global population was exposed to groundwater stress in the affected basins. Groundwater connects directly to food, and agriculture accounts for roughly 72 percent of global freshwater withdrawals. Irrigated agriculture produces a disproportionate share of global food output, and groundwater provides the drought buffer for some of the most productive agricultural regions on Earth.
There are solutions: better irrigation, crop switching, water pricing, managed aquifer recharge, desalination in certain applications and transferring surface water. There are even success stories. Parts of the North China Plain have experienced substantial groundwater recovery following pumping restrictions and massive water-transfer programs. But those solutions require investment, energy, political coordination and time. Of all the alleged collapse variables, aquifer depletion provides some of the strongest evidence that the overshoot problem is real.
Population: The Original Model Miss
World population was about 3.8 billion when Limits to Growth appeared. It is now more than twice that, so the population-pressure argument looks great until fertility is examined. Global fertility has fallen to approximately 2.25 births per woman, down from 3.31 in 1990. The United Nations now projects world population to reach approximately 10.3 billion in the mid-2080s and then begin declining. That is an enormous systemic reversal, the world is no longer following an indefinitely accelerating population curve. (This is a common trap that doomsday analysts and scientists fall into) Population is still increasing, and another two billion people will place significant additional demands on water, agriculture, electricity, housing and infrastructure. But the demographic threat has changed from unlimited exponential growth to something considerably stranger. (I’ve done some research that might explain this change.)
Some countries still face rapid population growth while others face population decline, worker shortages and rapidly aging populations. The World3 global aggregation hides this. From a collapse standpoint, population pressure looks less dangerous globally than the original exponential-growth assumption suggested, although regional differences will continue to cause pressure.
Food Production is Flatout Wrong
This is where the near-term collapse narrative begins running into actual data. The ZeroHedge article claims that global food production plateaued in 2023. The FAO data doesn’t support that at all. Global cereal production in 2025 reached approximately 3.04 billion tonnes, up 6.1 percent from 2024. Global cereal inventories also increased substantially. FAO expects production to decline around 2 percent in 2026, but from the exceptionally high 2025 level. That’s volatility, not a collapse.
Food insecurity remains serious, but increasingly the immediate problem isn’t production, it’s whether humanity can physically grow enough calories, whether people can afford them in some areas and whether those calories can move through functioning political and transportation systems. This isn’t collapse, and its certainly nothing new, it’s been going on since humanity started.
The 2026 UN food-security assessment estimated that about 645 million people faced hunger in 2025. That’s appalling, but it was also the third consecutive annual decline in global hunger. Meanwhile approximately 2.7 billion people cannot afford a healthy diet. Those statistics describe an unequal and fragile food system, but they don’t describe a food system entering global physical collapse. For a model predicting an imminent downturn in food production, this variable currently counts against the strongest collapse interpretation.
Figure 1. Comparisons between ZeroHedge collapse article and actual data.
Industrial Output: Another Problem for the Collapsists (Is that a word?)
World3 expects industrial output to peak before the deeper deterioration in food supply and population. The latest data haven’t suggested that at all. UNIDO reported that global manufacturing output increased another 1.2 percent quarter over quarter in the first quarter of 2026 and noted that worldwide manufacturing has maintained positive quarterly growth since early 2023. The IMF currently projects global economic growth of approximately 3 percent in 2026 and 3.4 percent in 2027. That doesn’t prove the system is sustainable, but if a model says industrial production is reaching its global peak, the observed industrial production rise is problematic. The next several years become interesting because
The 2024 World3 recalibration effectively placed its cards on the table by identifying the current decade as the turning region. If global industrial output, food production and welfare are still materially higher in 2030 than today, the sharp-collapse versions of World3 will have accumulated a significant forecasting failure.
Pollution and Climate
The pollution side of the model has aged much better. Atmospheric carbon dioxide continues reaching records. NOAA calculated a global average of roughly 425.6 parts per million in 2025, and measurements have continued rising during 2026. The World Meteorological Organization reports that 2025 was one of the three hottest years ever measured, approximately 1.44 degrees Celsius above the 1850-1900 average. The past eleven years were the eleven warmest years in the instrumental record. Global fossil-fuel carbon dioxide emissions also reached another record in 2025. Unlike food or industrial production, there is no obvious reversal in this trend.
The original World3 pollution variable was extremely crude compared with modern climate science, but its underlying systems argument was remarkably perceptive: Increasing industrial activity can create delayed environmental costs that are initially invisible to the economic system producing them. The pollution constraint is therefore one area where Limits to Growth looks more like an early sketch of a problem we now understand in far greater detail.
Scorecard
| Variable | What the current data show | Support for collapse thesis |
|---|---|---|
| Population | Still rising, but fertility collapsing and global population expected to peak | Mixed |
| Arable land per person | Down roughly 42% since 1972 | Strong concern |
| Total cropland | Still expanding globally | Weakens depletion claim |
| Land degradation | Already reducing yields across heavily populated regions | Strong concern |
| Groundwater | Widespread decline, accelerating in many aquifers | Very strong concern |
| Global food production | Near record levels | Contradicts imminent collapse |
| Hunger | Severe but recently declining globally | Mixed |
| Industrial output | Still increasing | Contradicts imminent collapse |
| Human development | Record level but improvement has nearly stalled | Moderate warning |
| Nonrenewable resources | Scarcity exists, but substitution and reserves make aggregate modeling difficult | Uncertain |
How Accurate Is the Collapse Scenario?
If I had to grade the different claims separately, I would give them very different scores
“Civilization will collapse in 2040”: 3/10
There is no defensible statistical basis for treating 2040 as an expiration date. World3 was never designed to provide that precision, Herrington did not claim it could, and the newer recalibration explicitly warns that the timing of the turning point is unreliable.
“Human civilization is overshooting important physical systems”: 8/10
Groundwater depletion, declining farmland per person, land degradation, greenhouse-gas accumulation and ecological stress provide considerable empirical support for this claim.
“Current economic growth can continue indefinitely in its existing physical form”: 2/10
A finite planet eventually requires substitution, recycling, technological change or stabilization of material throughput. That conclusion is almost mathematical rather than ideological.
“We are already observing the beginning of a global collapse”: 4/10
Some indicators resemble the beginning of stagnation or declining resilience. But global food production, manufacturing output, GDP and human development have not entered the broad simultaneous decline that World3 would call collapse.